
Spatial join, buffer and distance on a plain CSV easily in a canvas
Seven geospatial nodes for Flowfile: read Shapefile or GeoJSON, point-in-polygon spatial join, buffer, distance and a map preview, all on a plain CSV.
Flowfile had no geospatial support. Via community nodes we’ve added the first seven. They are community nodes, not part of the core: install them from the catalog with one click, Flowfile 0.17.4 or later.
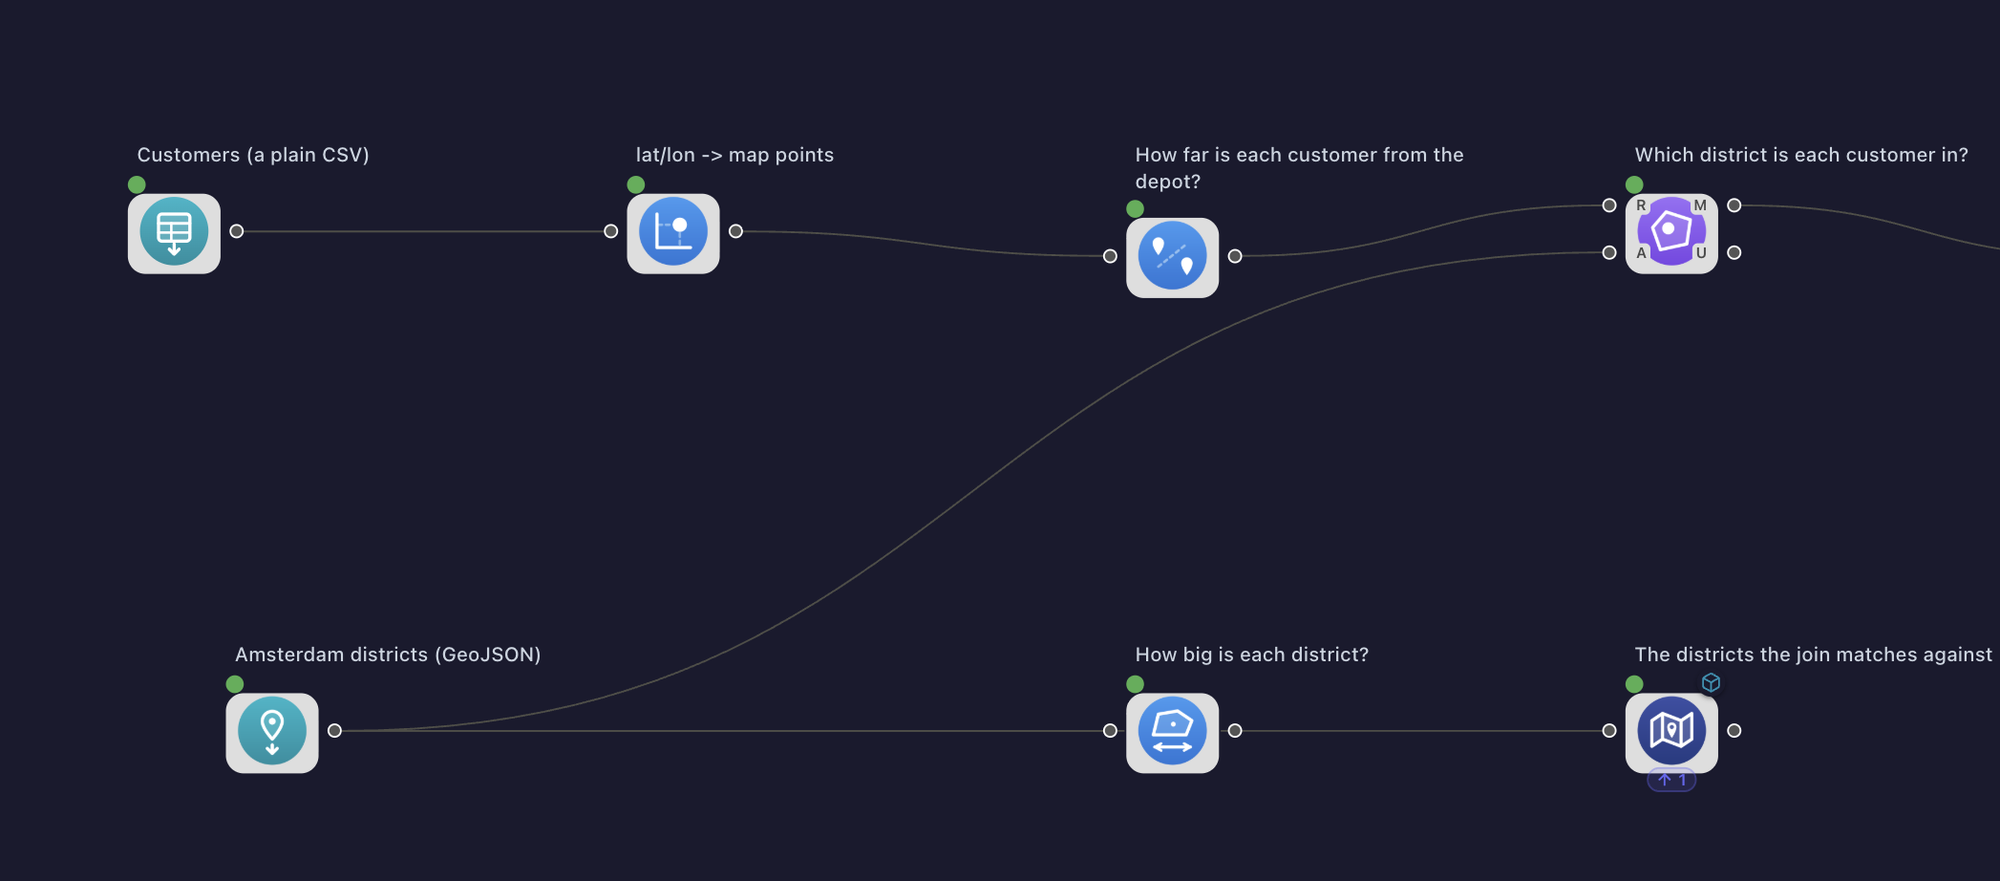
I am not a GIS person. What I wanted was the handful of questions that come up in ordinary business data, where the answer used to be “export to QGIS” or “ask someone with a geopandas environment”. So the example is ordinary business data: a CSV of customers with a latitude and a longitude column, and a GeoJSON of Amsterdam districts. This is the whole flow.
Added capabilities
- Spatial Read: Shapefile, GeoJSON, GeoParquet, FlatGeobuf, GeoPackage or KML into a table.
- Create Points: lat/lon columns to a point per row. Also takes a national grid if you give it the EPSG code.
- Distance: between two places on the same row, in km, metres or miles.
- Buffer: everything within X metres of a shape, measured on the ground.
- Spatial Join: inside, surrounds, touches, or within a distance. Matched and unmatched outputs.
- Measure: area, perimeter, centroid, number of corners.
- Map Preview: SVG map with an optional OpenStreetMap background.
They are all at flowfile.io/community-nodes?tags=geospatial.
Group customers by district with a spatial join
The customer sheet has coordinates, but you do not want to group on lat/lon. You want to group on something you can put in a report: district, postcode region, sales territory. Those areas live in a map file, and each customer row needs its area on it before a Group By can use it.
That is the top and bottom branch of the flow meeting in the middle.
Spatial Read loads the districts file. Shapefile, GeoJSON, GeoParquet, FlatGeobuf, GeoPackage or KML, one row per shape with its attributes next to it. Whatever coordinate system the file was saved in, it comes out as plain lat/lon, so a Dutch CBS shapefile in RD works without you knowing what RD is.
Create Points turns the customer sheet into shapes. Pick the two columns, every row gets a point.
Spatial Join puts them together. Every customer against every district, rule “falls inside”. Matched rows come out of the top output with the district’s columns attached. Rows that hit nothing come out of the bottom output unchanged, so a customer outside the city does not silently disappear from the totals.
From there it is a normal Group By: customers per district, revenue per district, whatever the sheet had.
Distance from each customer to the depot
Between Create Points and the join, the flow has one more node. Distance works straight off four lat/lon columns on the same row, no shapes needed: from lat, from lon, to lat, to lon, and you get a column in km, metres or miles. The depot coordinates go on every row with a Formula node first. A Filter on [km_to_depot] < 10 after that is your delivery zone.
If you already have shapes, it also measures centre to centre between two shape columns.
Measure the area of each district
On the districts branch, Measure adds area, perimeter or length, the centre point and the number of corners as ordinary columns. District area in km² next to customers per district gives you density. A Filter on area throws out the slivers a bad shapefile always has.
Draw it on a map before you trust it
Map Preview draws the shapes. Pick what to show on hover, what to write next to each shape and what to colour by, and after the run the map is in the node’s Artifacts tab. Plain background, OpenStreetMap streets, or your own tile server. The data passes through unchanged, so it sits anywhere in the flow.
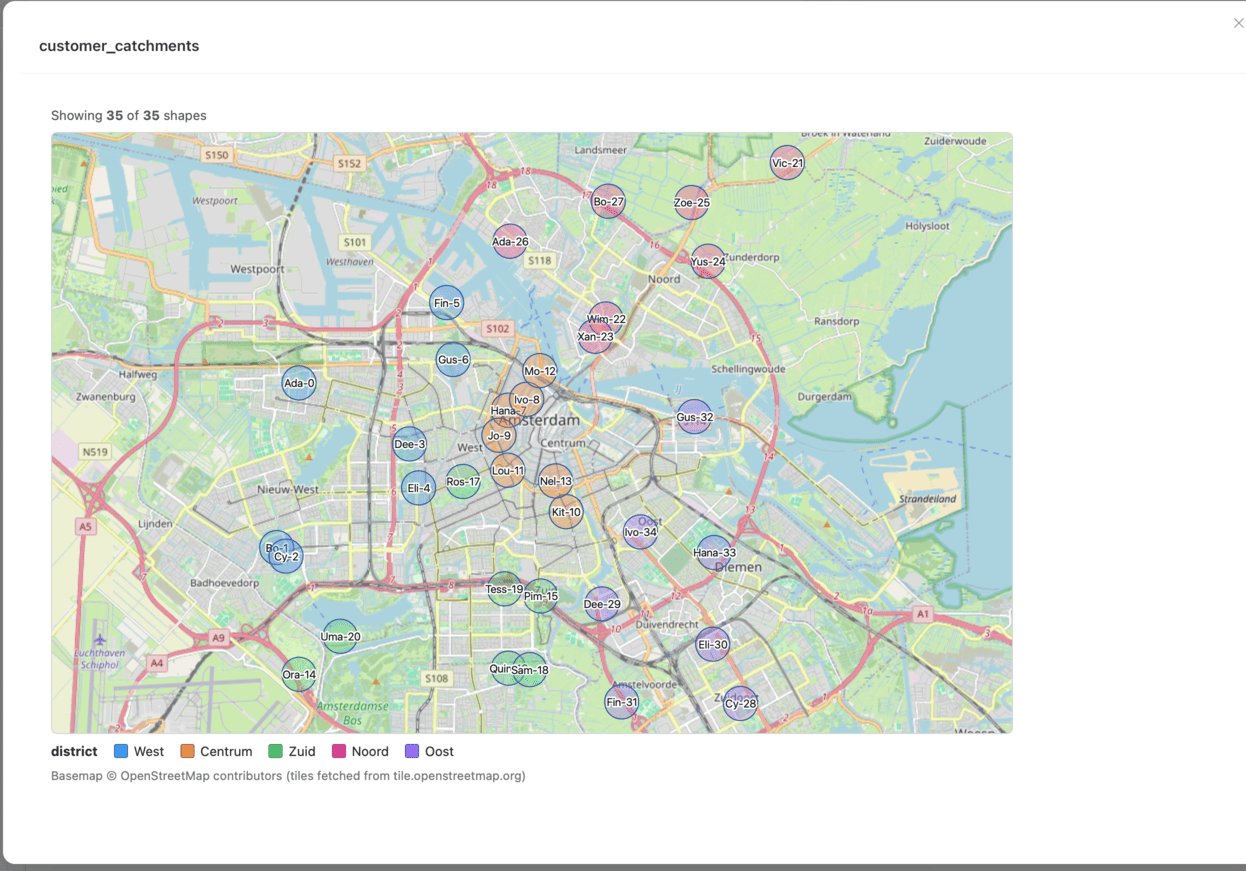
This is the customer side: 35 customers, coloured by the district the spatial join gave them, with customer, district and distance to the depot on hover. Half the value of the map is catching that the join used the wrong shape column.
Buffer: who is within 400 m of a store
The circles on that map are not points, they are 400 m zones. Buffer grows every shape by a set distance, measured on the ground, so 400 m is 400 m in Norway as well as at the equator. A negative distance shrinks the shape instead.
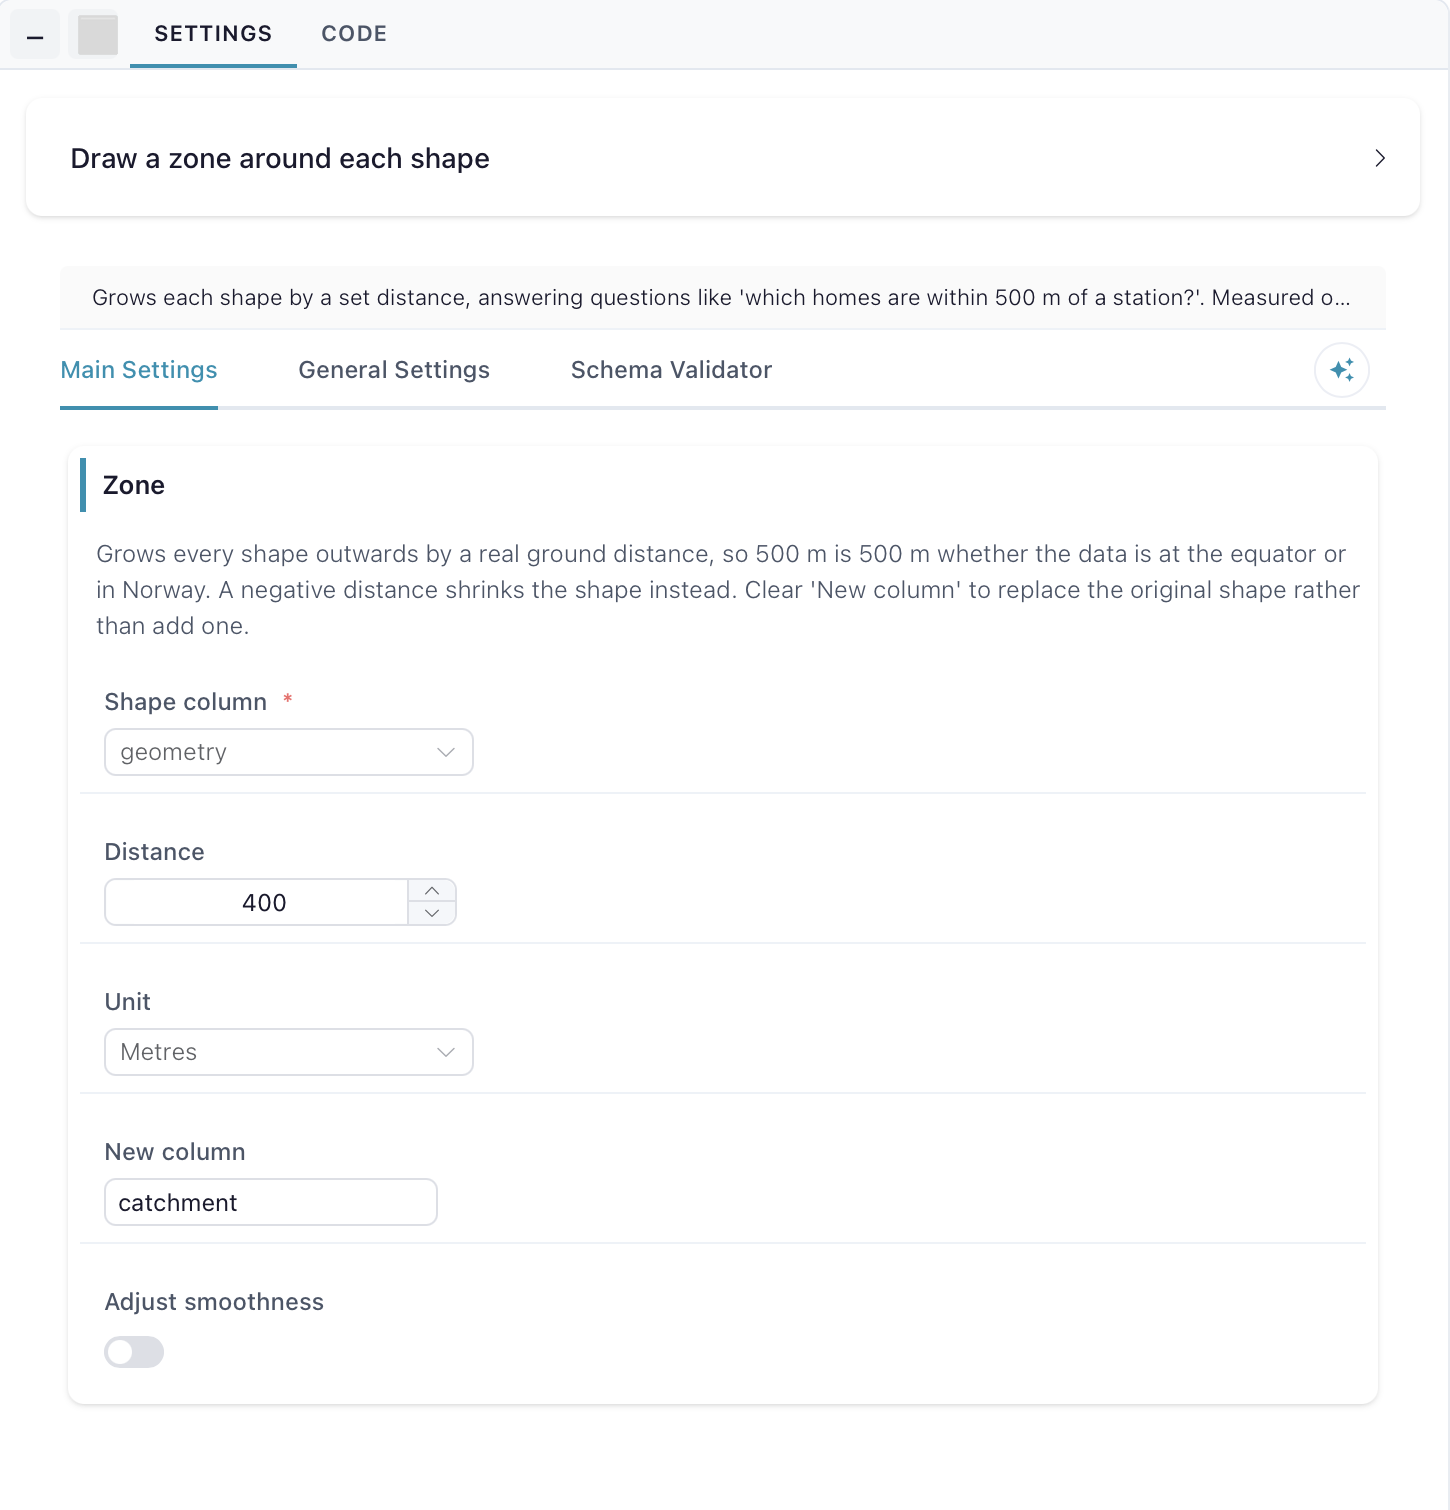
Buffer is how you ask “who is within 400 m of a store”: buffer the stores, then Spatial Join the customers against the zones. Or skip the buffer and flip Spatial Join to “within a distance” mode, which matches anything within X metres of anything. Buffer is for when you want the zone as a shape you can draw and reuse.
Geometry travels between nodes as WKT text in a normal string column, always WGS84. That was a deliberate choice. Binary columns cannot cross the preview grid, and text can be read by anything downstream, including a plain Filter node. Underneath it is DuckDB’s spatial extension, which downloads once on first use.
If you have a transform you rewrite in every pipeline, this is the way to share it now. If you build a node and the SDK is in your way, tell me.
- Flowfile: github.com/edwardvaneechoud/Flowfile
- Community nodes: flowfile.io/community-nodes