

Map Preview
v0.1.0Draws the shapes on a map you can open from this node's Artifacts tab after a run. The data passes through unchanged, so you can drop it anywhere in a flow.
Map Preview
What it does
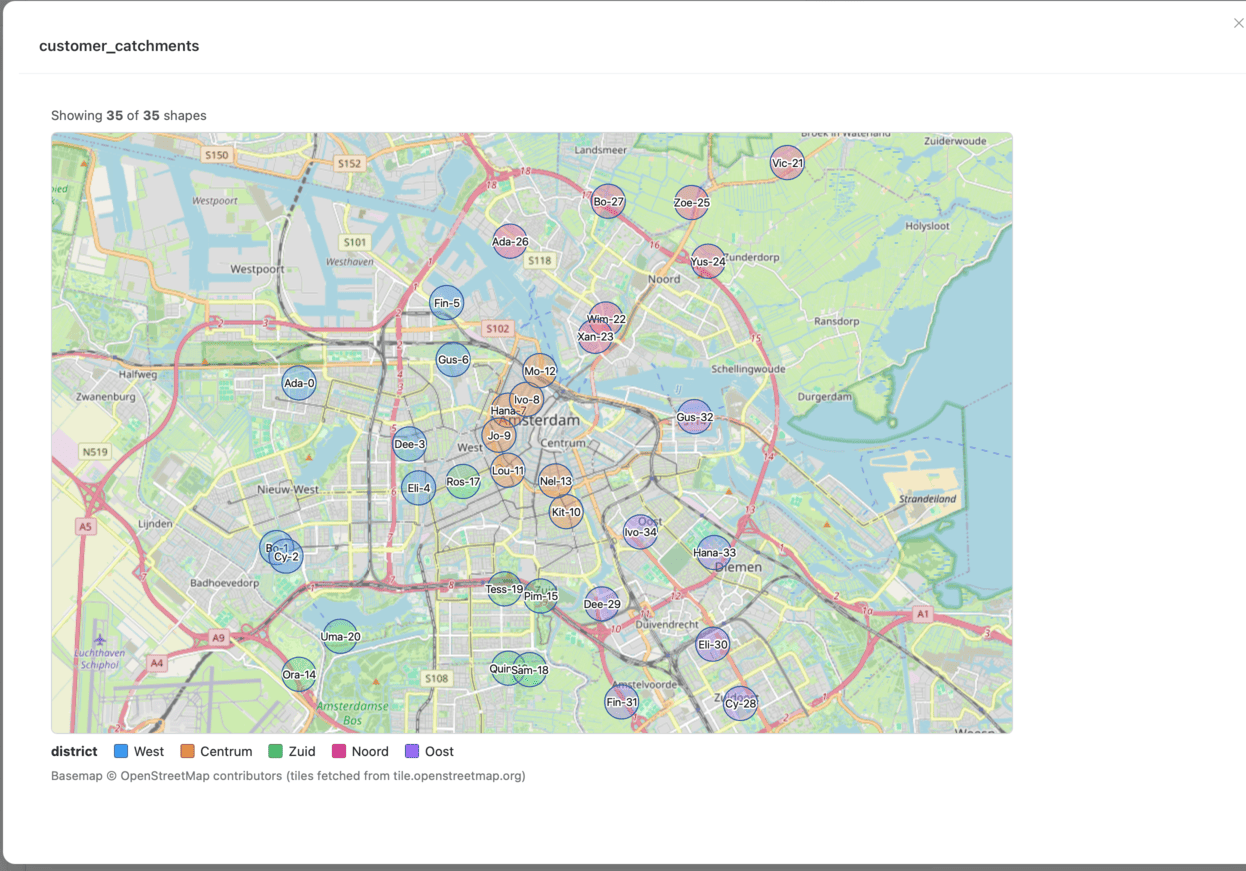
This node draws the shapes on a map you can open from this node’s Artifacts tab after a run. The data passes through unchanged, so you can drop it anywhere in a flow. Shapes are WKT text in longitude/latitude degrees (EPSG:4326); the node also reads hex WKB or binary WKB. Runs on a Docker kernel.
Inputs
One table with a text or binary shape column, plus any columns you want to hover over, write next to a shape, or colour by. Empty and unreadable shapes are skipped and counted in a note under the map.
Settings
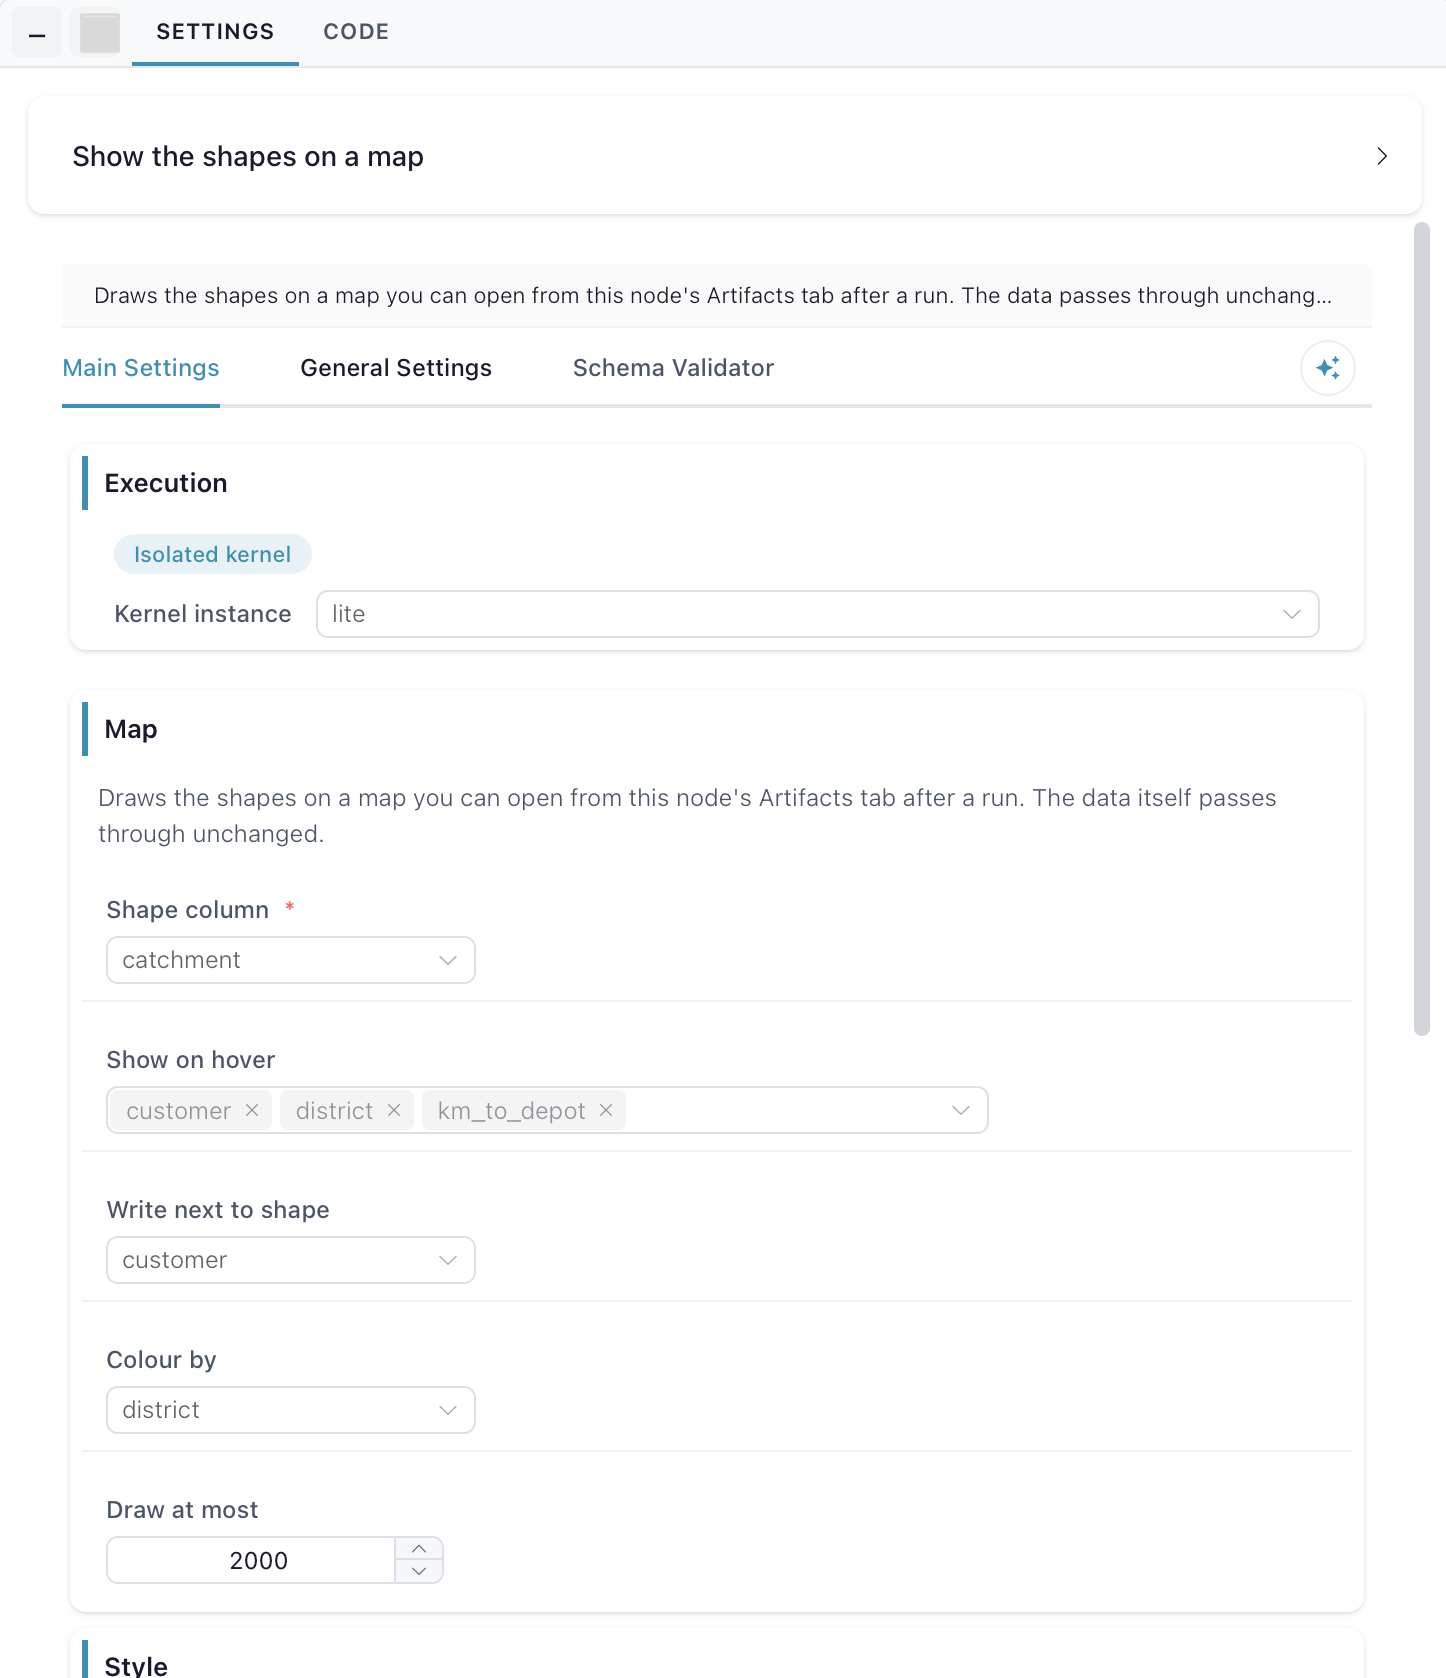
Map — the shape column and what to show with it: Shape column, Show on hover, Write next to shape, Colour by, and Draw at most, which caps how many shapes are drawn (spread evenly over the whole table).
Style — Background is either Plain or OpenStreetMap streets; a street background downloads images from another organisation’s server, and OpenStreetMap’s free tiles are for light use only. Shape colour and Outline colour set the fill and the outline. Simplify (degrees) is in degrees, so 0.001 is roughly 100 m of detail; leave it at 0 to keep every outline. Use my own tile server replaces the background with a tile server you host or pay for.
Tile server — Address is the address of your tile server, with {z}, {x} and {y} standing in for the tile. Shown only when “Use my own tile server” is on.
Saved map — Name is the artifact the map is saved under.