1 Install 2 Connect 3 Build 4 Catalog 5 Automate 6 Extend Swipe to explore →
1 / 6 · Install Start on your own machine. Download the desktop app, or install with Python. The editor, catalog, SQL tools and scheduler come together.
Flowfile on your machine Visual editor Data catalog SQL & dashboards Scheduler
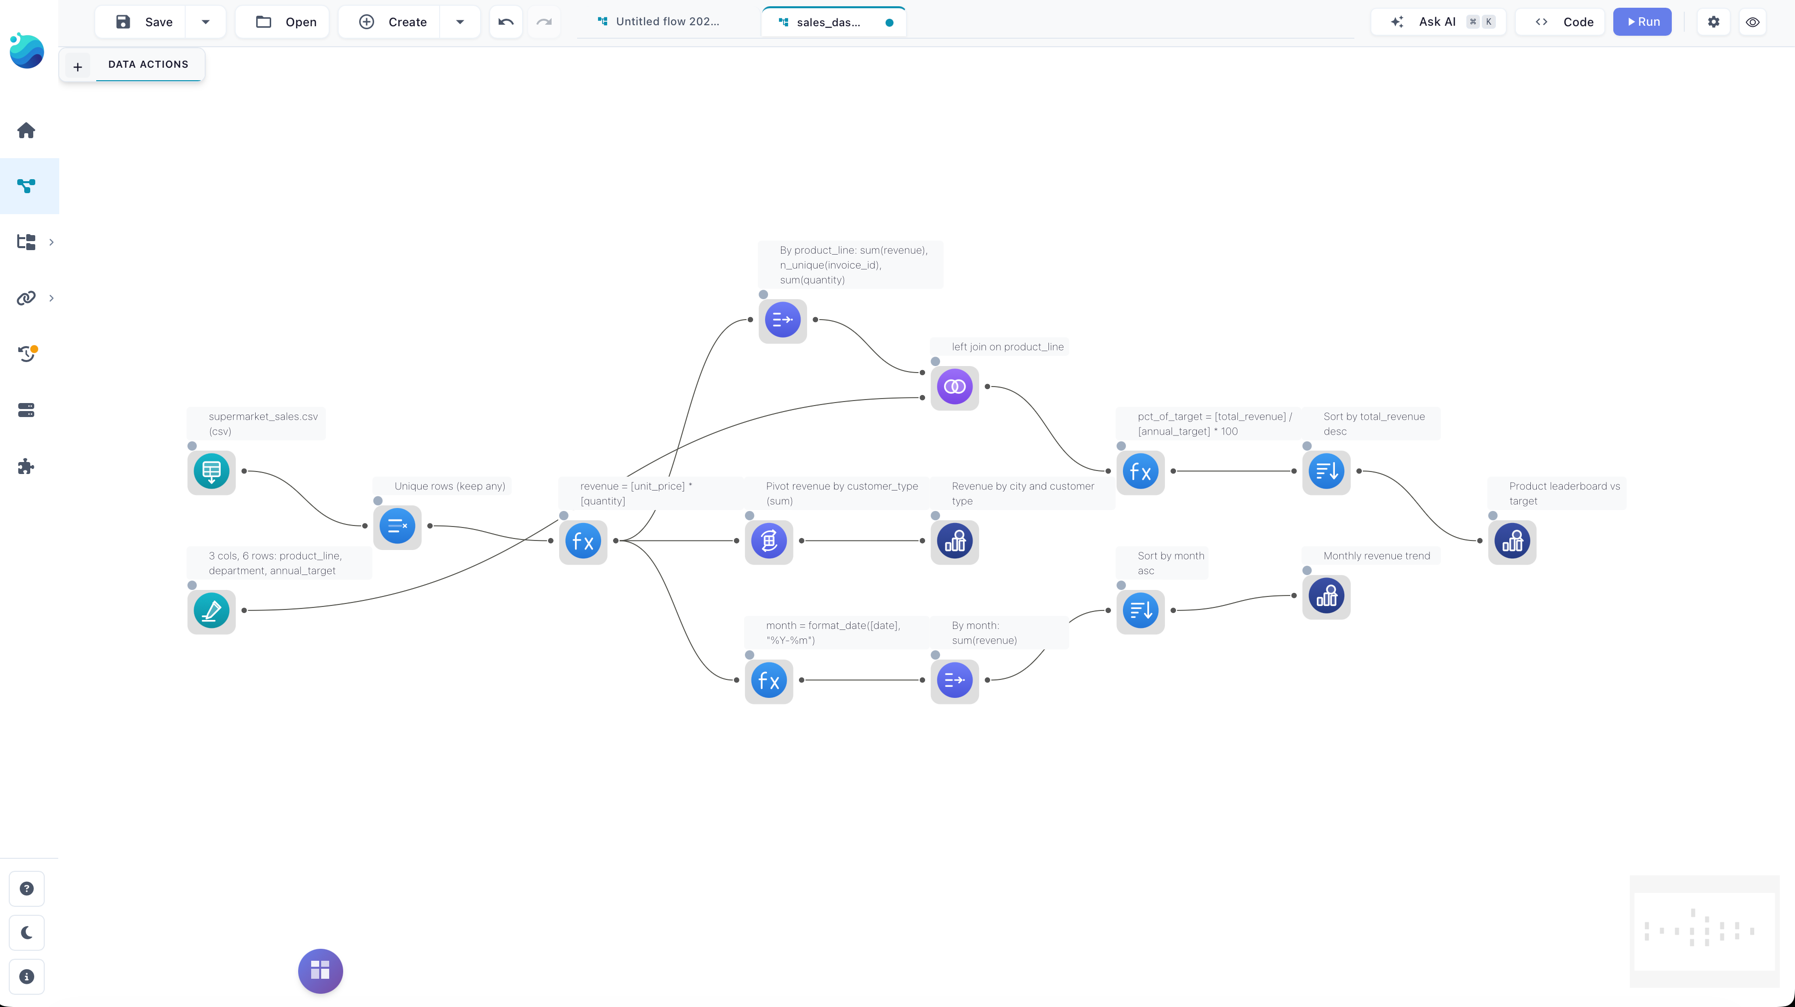
Or install with Python pip install flowfile
One install gives you a place to build and run your data work.
2 / 6 · Connect Bring in the data you work with. Open an Excel file, read from a database, or connect to cloud storage and APIs. Save connections to use them in your next flow.
Your flow Read from the source. Explore all 23 connectors and 28 transformations →
3 / 6 · Build Build the steps. Check the result. Join, filter, pivot, fuzzy match, or write a formula. See the columns and preview the data at each step. Add Python when you need it.
Result: sales by region Example data
Example sales totals after joining orders to customers and grouping by region region str revenue f64 North 400.00 South 85.00
Inside the transformation Group sales by region
# The same operation in Python Inspect the logic behind a visual step.
View Python ↗ A repeatable pipeline you can inspect, explain and run again.
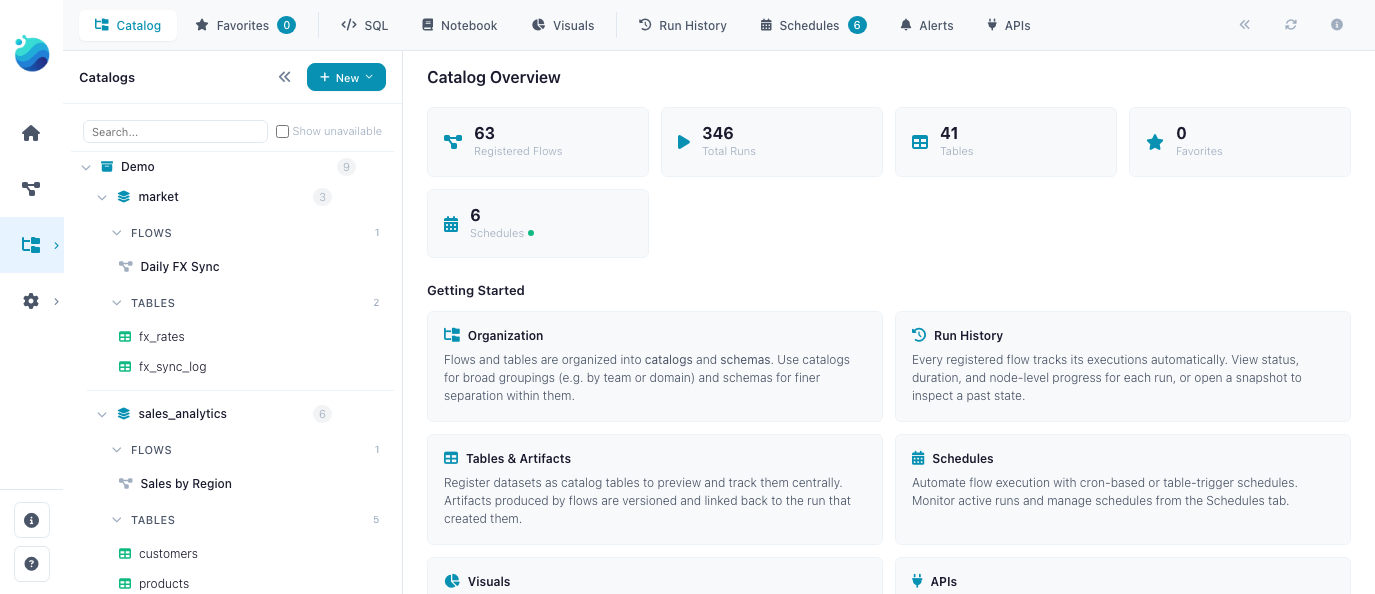
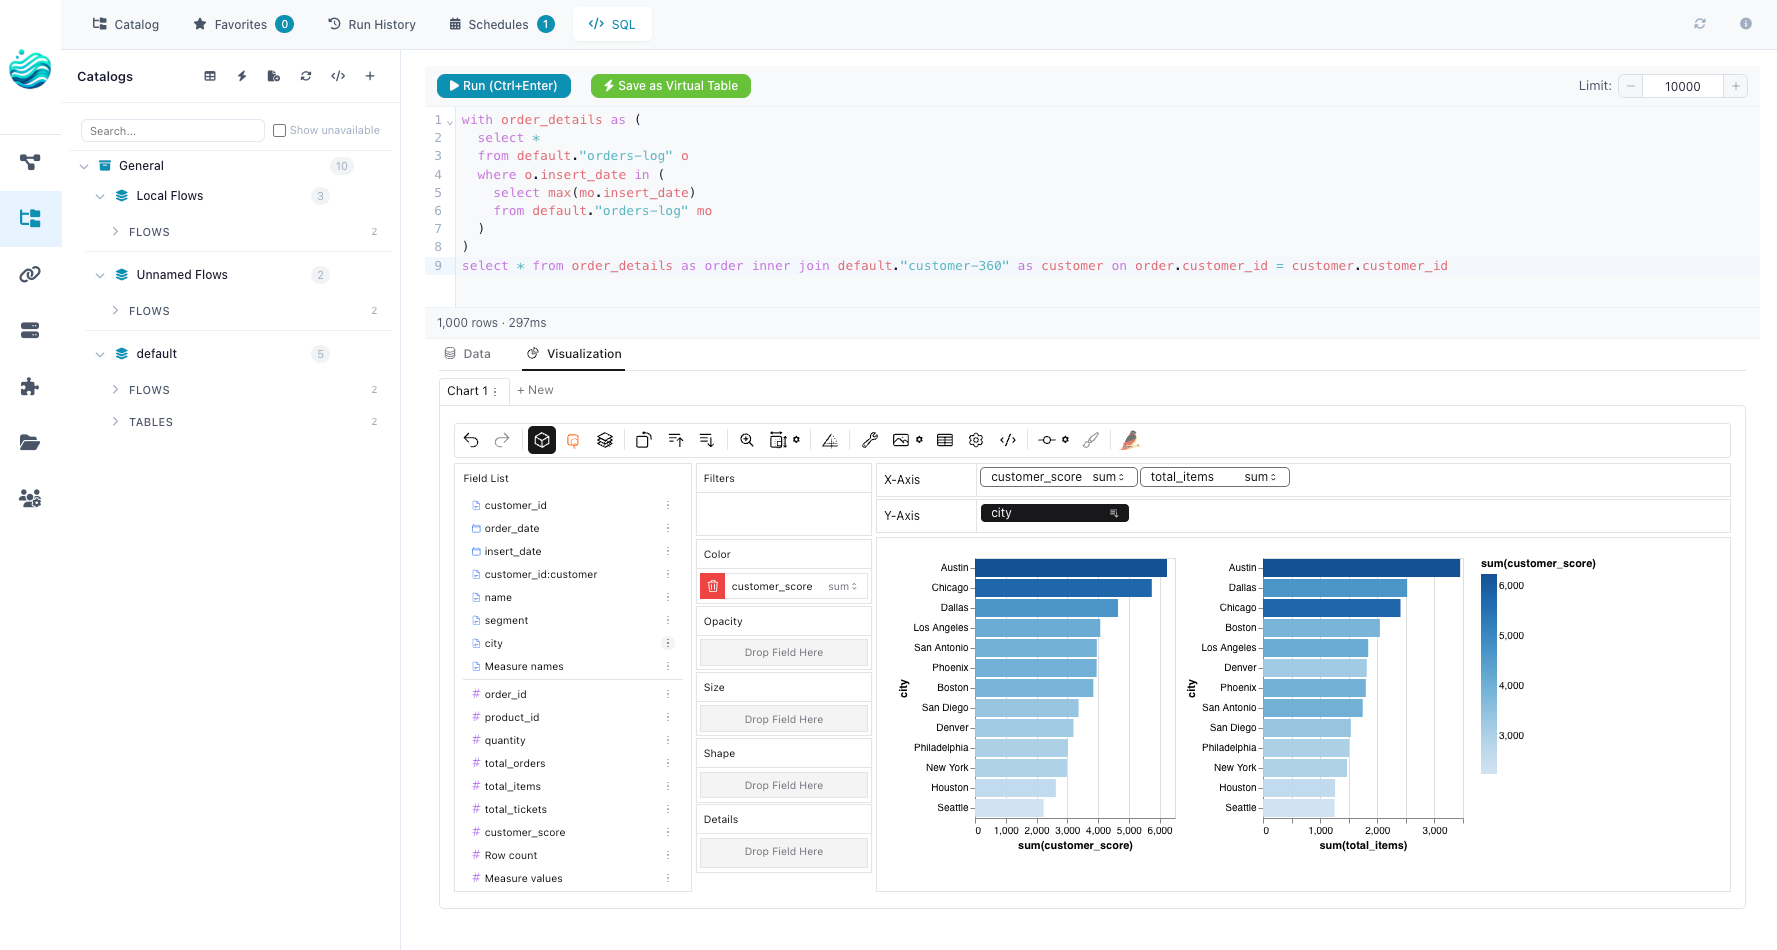
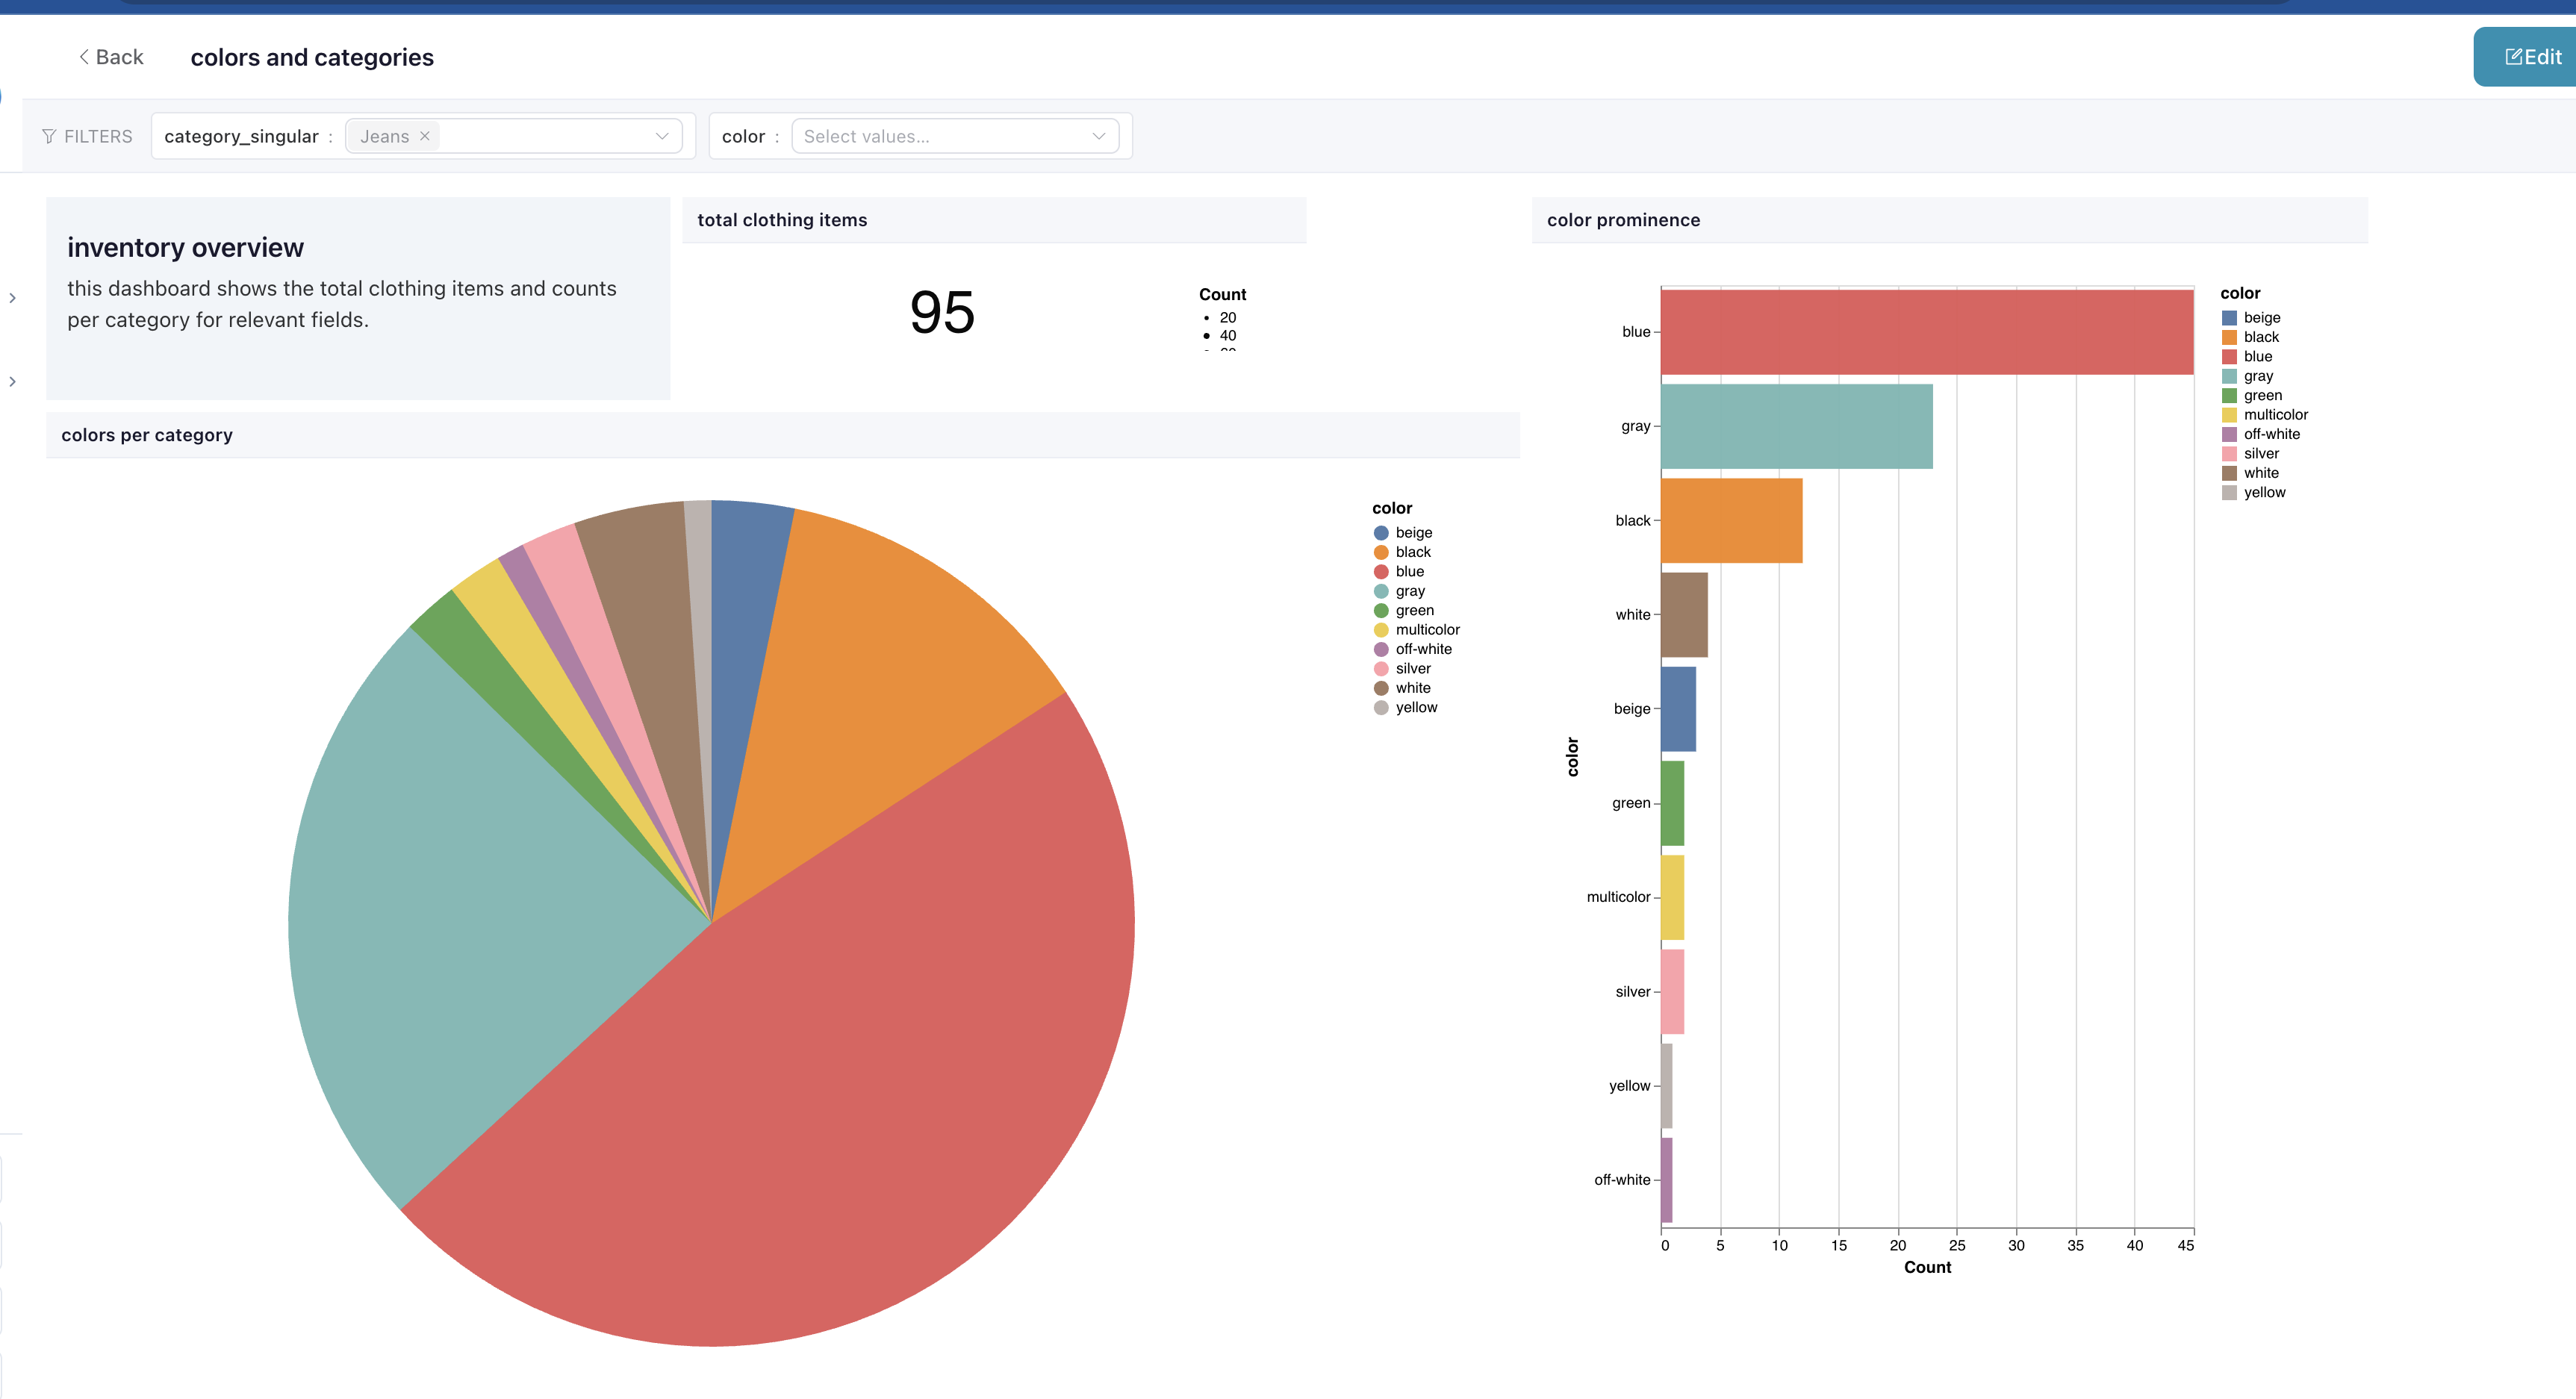
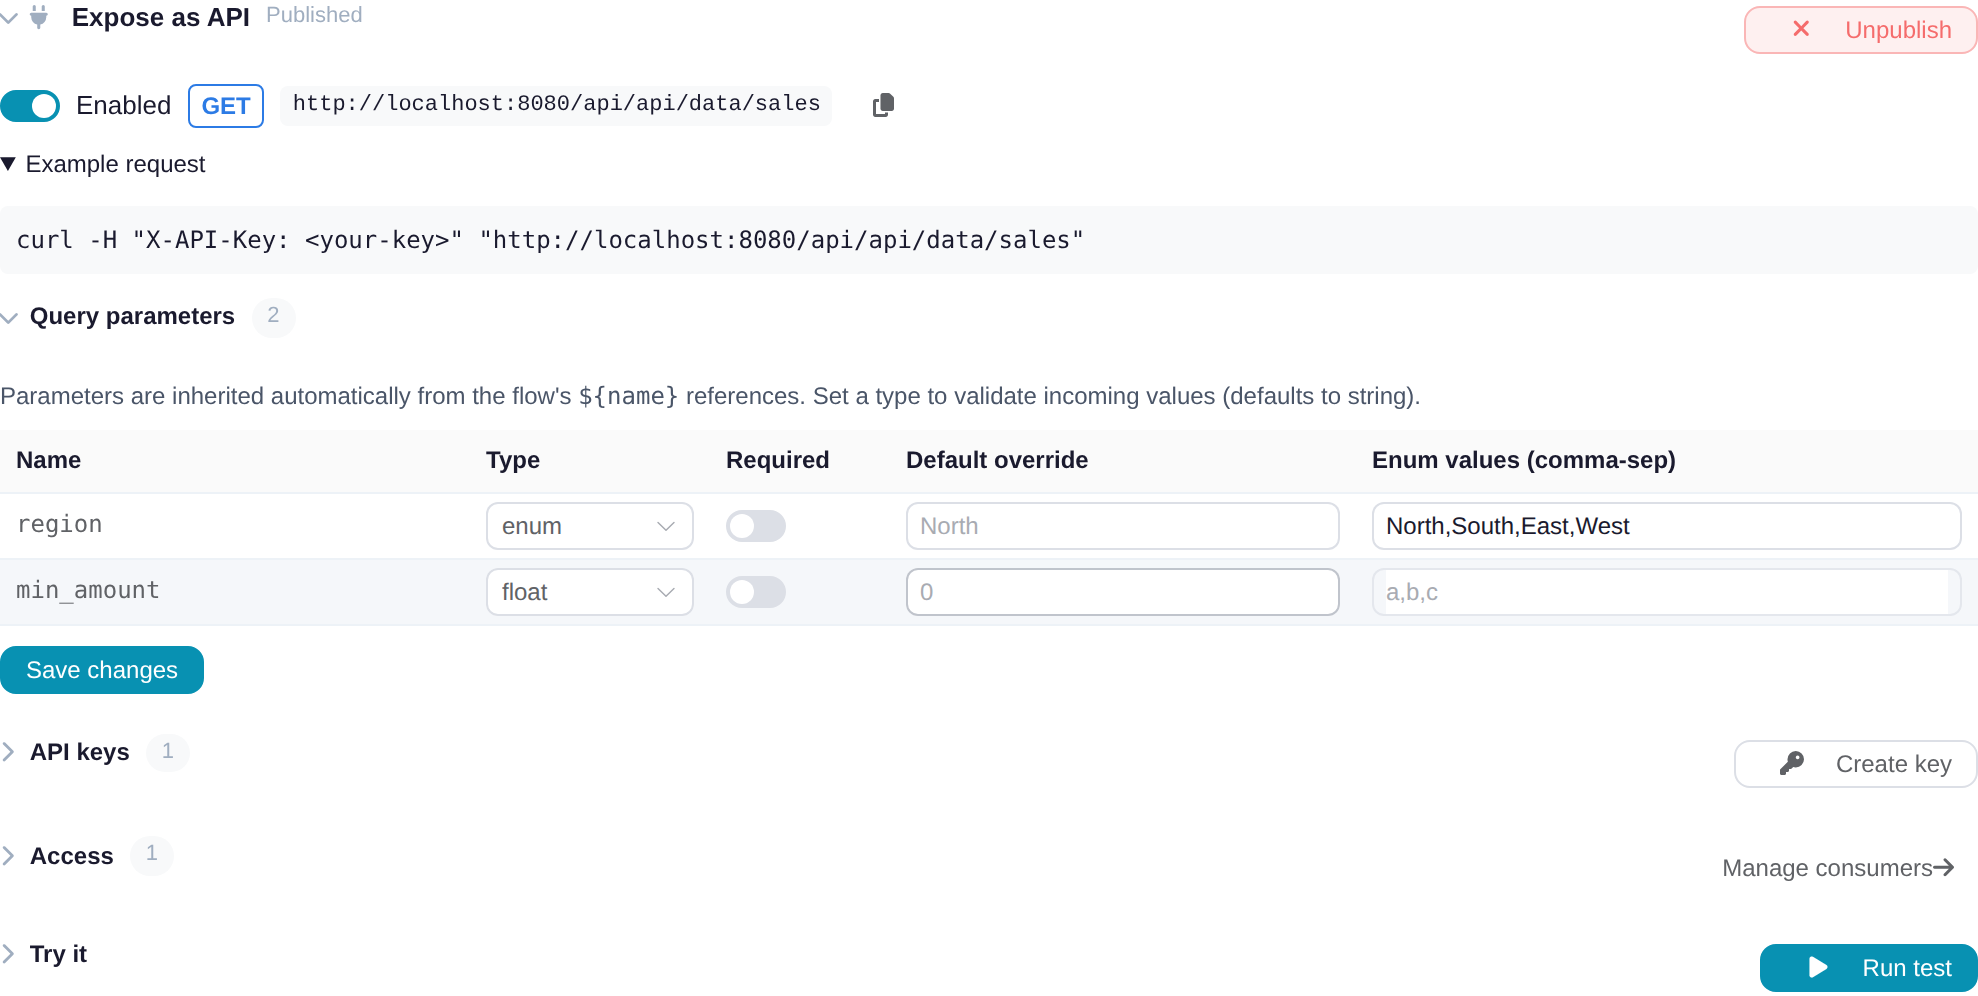
4 / 6 · Catalog Put the result to work. Store tables in the catalog, analyse them with SQL or Python, and create dashboards. Publish registered flows as endpoints for other applications.
Your catalog Tables, flows and the work built on them
Store Delta tables, versions & lineage
Analyse SQL queries & Python notebooks
Visualise Saved charts & dashboards
Serve Flows as API endpoints
Inside the catalog sales_by_region
Table preview 2 rows · 2 columns
region revenue North 400.00 South 85.00
Store the result. Query it or use it in a dashboard.
Preview table ↗ Your data, analysis and the flows behind them stay connected.
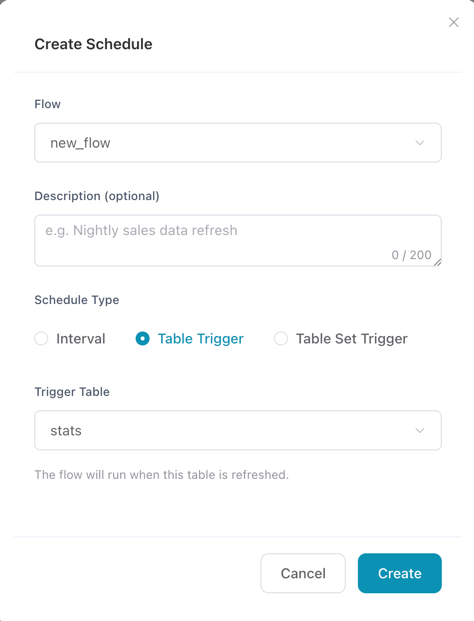
5 / 6 · Automate Keep the data up to date. Run on a schedule or when a catalog table changes. Check run history, see which nodes ran, and configure notifications when something fails.
◷ When the data changes Catalog table trigger
or on a schedule Run the flow
↓ Update the catalog table
↓ Read the latest data in your dashboard
Run history · Node status · Failure notifications
The flow refreshes the table your dashboard reads. The host machine needs to be running.
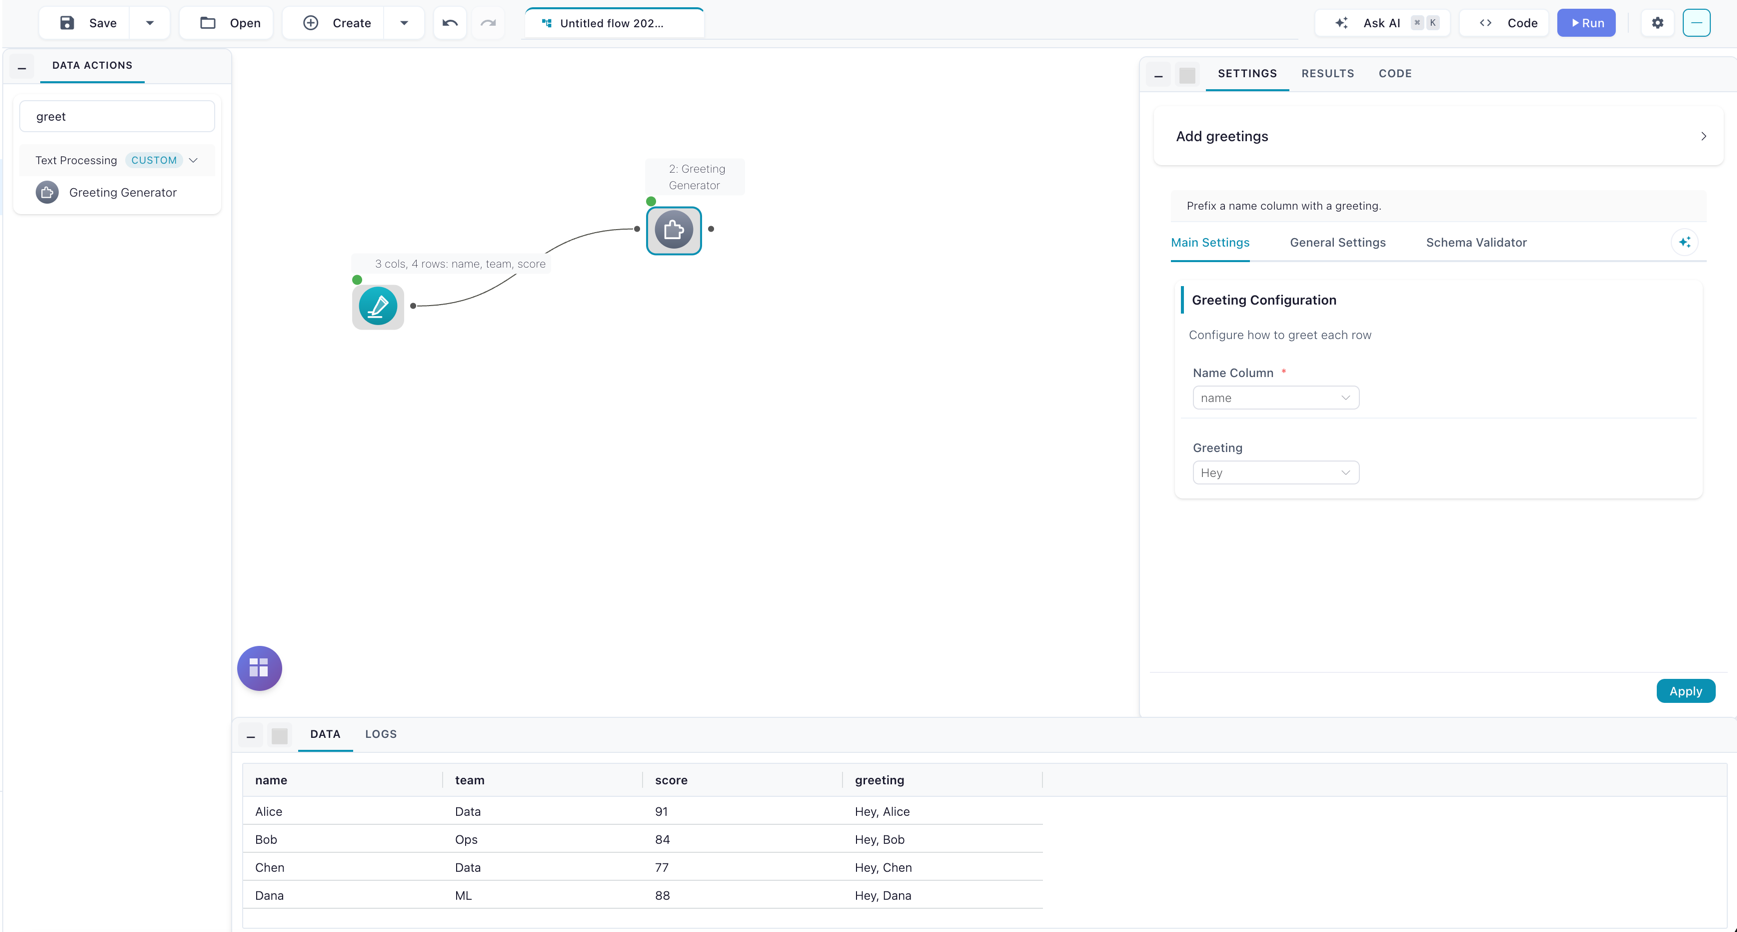
6 / 6 · Extend Add the parts your work needs. Write custom nodes in Python, install community nodes, or use isolated kernels with your own packages. An optional assistant can help build the graph.
Your transformation logic def clean_names(df):→ Clean names Your own node Package your rules as a reusable node, with settings and a data preview.
Reuse your own transformations alongside the built-in nodes.
 Flowfileon your machine
 Your flowRead from the source.







 Group by
 Catalog
 Clean namesYour own node