What Is a Data Pipeline? A Plain-English Guide for Analysts
A data pipeline is a saved recipe that turns raw data into something useful. Here's what one is, what the parts are called, and how to build your first one without a data engineering degree.
TL;DR. A data pipeline is a saved recipe that turns messy raw data into something you can actually use. It has three parts: somewhere data comes from, a sequence of transformations, and somewhere data goes. Modern pipeline tools let you build the recipe visually — by connecting boxes — and re-run it on new data with one click. You don’t need to be a data engineer. You don’t need to learn a new language. And once you have one, you’ll wonder how you ever lived without it.
What is a data pipeline, really?
If you cook from a recipe, you already understand a data pipeline.
A recipe says: take these ingredients, do these steps in this order, end up with this dish. You can follow it on Tuesday with chicken and on Thursday with tofu. The recipe doesn’t change — only the inputs do.
A data pipeline says exactly the same thing: take this data, do these steps in this order, produce this output. Run it on January’s sales export and you get January’s report. Run it on February’s, you get February’s. The pipeline doesn’t change — only the inputs do.
That is the whole concept. Everything else is detail.
The three parts of every pipeline
Every data pipeline, no matter how fancy, has three parts:
| Part | What it is | Examples |
|---|---|---|
| Sources | Where data comes from | A CSV on disk, an Excel workbook, a database table, an S3 bucket, a Kafka stream |
| Transformations | What you do to the data | Filter rows, add a column, join two tables, group and aggregate, sort, deduplicate |
| Destinations | Where the result goes | A new file, a database table, a dashboard, an email attachment, a managed catalog |
If you can name those three things for any task — where it starts, what happens, where it ends — you can describe a pipeline.
Why “pipeline” is a useful metaphor
Imagine water moving through a series of pipes. Each pipe segment does one thing: a filter cleans out debris, a junction merges two streams, a meter measures the flow. The water goes in one end and comes out the other, transformed.
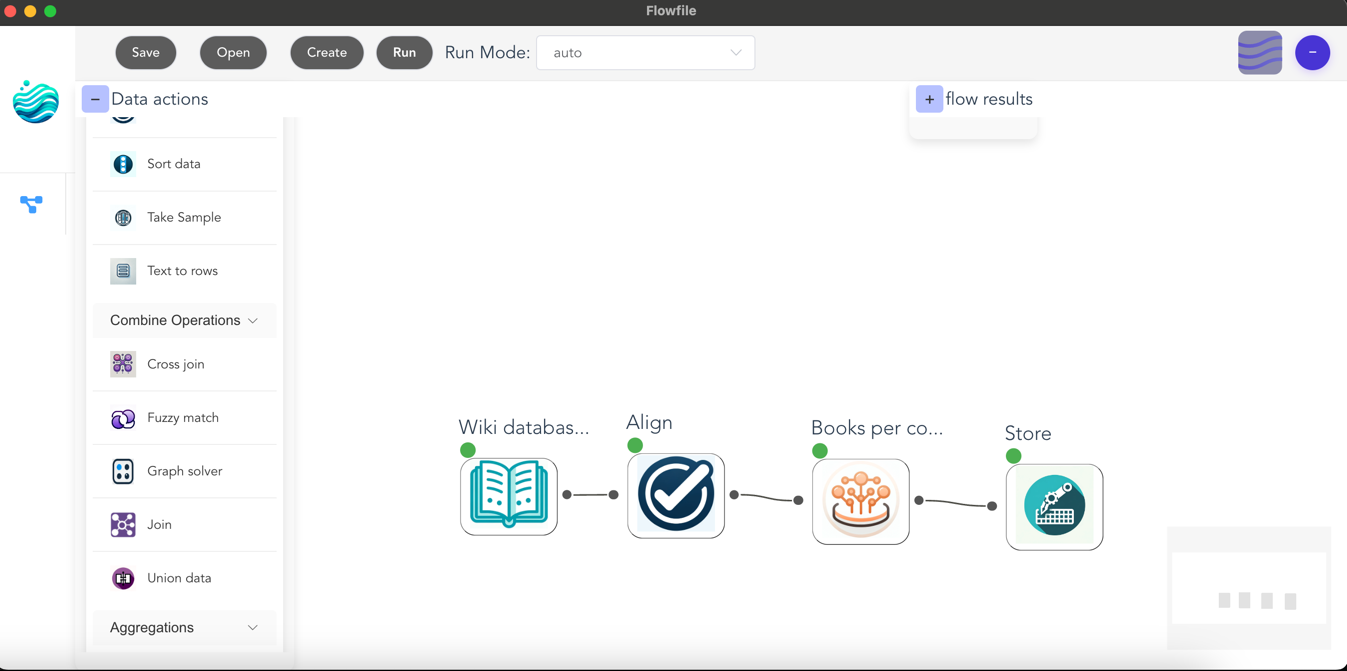
Data pipelines work the same way. Each “node” — a box on a canvas — does one thing. Data flows from node to node. You can branch the flow, merge it back, add a new step in the middle, or rip out a step entirely. The shape of the flow tells you, at a glance, what the pipeline does.
This is why visual pipeline tools have become so popular: a connected diagram of boxes is much easier to read than 400 lines of code that does the same thing.
A worked example: the customer monthly summary
Let’s build one. Suppose marketing wants a monthly summary by region: total spend, number of orders, top product.
The pipeline:
- Load orders from
orders.csv - Load customers from
customers.csv - Join orders to customers on
customer_idso each order has a region - Filter to the current month
- Group by region and aggregate: sum of spend, count of orders, mode of product
- Sort by spend descending
- Write to
monthly_summary.xlsx
That’s seven nodes on a canvas. Here is what it would look like in Flowfile’s Python API for readers who are curious — the visual canvas does the same thing without you typing anything:
import flowfile as ff

orders = ff.read_csv("orders.csv")
customers = ff.read_csv("customers.csv")

(orders
    .join(customers, on="customer_id", how="left")
    .filter(ff.col("order_date").dt.month() == 4)
    .group_by("region")
    .agg([
        ff.col("spend").sum().alias("total_spend"),
        ff.col("order_id").count().alias("num_orders"),
    ])
    .sort("total_spend", descending=True)
    .write_excel("monthly_summary.xlsx")
)
Two months from now, you swap in the new files and re-run. That is the entire payoff.
ETL vs ELT vs “data pipeline”
You will see these three terms used almost interchangeably. The difference is the order of operations:
- ETL — Extract, Transform, Load. Pull the data out, clean it up first, then load it into the destination. This was the dominant pattern when “the destination” was an expensive warehouse and you wanted to keep junk out.
- ELT — Extract, Load, Transform. Dump the raw data into the destination first, then transform it there. Modern warehouses (BigQuery, Snowflake, DuckDB) made this practical because storage got cheap and warehouse compute got fast.
- Data pipeline. The umbrella word for any of the above. Also covers streaming pipelines (where data flows continuously rather than in batches), reverse pipelines (warehouse back to operational systems), and everything in between.
You don’t need to memorise the distinction. Most people working with everyday data just say “pipeline”.
What “lazy evaluation” means and why you should care
You will see modern pipeline tools advertise lazy evaluation. It sounds technical. It is not.
A lazy tool waits until you ask for the final result, then plans the most efficient way to compute it — combining steps, skipping work, pushing filters as early as possible. An eager tool does each step the moment you describe it, whether or not the result is ever used.
The practical difference: lazy pipelines are dramatically faster on large data because they don’t waste effort on intermediate results nobody asked for. Polars (the engine Flowfile uses) is lazy by default. You don’t have to do anything to benefit — but it’s the reason a 50-million-row pipeline can finish in seconds rather than minutes.
Visual or code? Both, ideally.
There is a real division in the pipeline world between visual tools (drag-and-drop canvases) and code tools (Python, SQL, dbt). Each side has loud opinions.
The honest answer is that they are good at different things:
- Visual tools are unbeatable for exploration — figuring out what shape your data is, what joins make sense, what the report should even be.
- Code tools are unbeatable for production — version control, code review, automated testing, deployment.
The best modern tools refuse to pick a side. Flowfile is one of them: a pipeline built from the core transform and file nodes exports as a standalone Polars script — real Python, no Flowfile dependency — and a pipeline written with its Python API opens in the visual canvas as a graph. You build the prototype on the canvas, then ship the code. And if a flow uses a step that can’t be converted, the export says so up front instead of handing you a script with holes in it.
Building your first pipeline
If you want to actually build one, the lowest-friction starting point is the Flowfile browser demo. It runs entirely in your browser, no signup, with a starter set of nodes. Pick a CSV you already have. Try loading it, filtering some rows, and writing the result back out. That is a complete pipeline. Everything you’ll ever build is just a longer version of those three steps.
When you’re ready for the real thing — bigger data, all 30+ node types, the data catalog, scheduling — install Flowfile locally with pip install flowfile or grab the desktop app. Both are free, both run on your machine, and your data never leaves your laptop unless you tell it to.
Next reads: Automate Your Excel Workflows Without Writing Code for an Excel-user-friendly walkthrough, or Polars vs Pandas in 2026 once you’re ready to peek under the hood.
Frequently asked questions
- What is a data pipeline in simple terms?
- A data pipeline is a saved set of steps that takes data from one place, transforms it, and delivers it somewhere else. Think of it as a recipe a computer can re-run on demand: load the file, clean it up, join it with another table, summarize, save the result.
- What's the difference between ETL and a data pipeline?
- ETL — Extract, Transform, Load — is one specific shape of data pipeline. All ETL processes are pipelines, but not all pipelines are ETL: some only transform in place, some stream continuously, some load before transforming (ELT). The word 'pipeline' is just the broader umbrella.
- Do I need to be a developer to build a data pipeline?
- No. Visual tools like Flowfile let you build a complete pipeline by dragging nodes onto a canvas. You only switch to code if you want to — and even then, the same pipeline can be exported as a standalone Python script.
- What does 'lazy evaluation' mean in a data pipeline?
- Lazy evaluation means the tool plans the whole pipeline before running anything, then optimises the plan. Instead of doing each step one row at a time, it figures out the most efficient way to do all the steps together. You don't have to think about it — it just makes things fast.
- How is a data pipeline different from a script?
- A script runs top-to-bottom and you have to read it carefully to see what it does. A pipeline shows the same logic as a graph of named steps, so the structure is obvious at a glance. Most modern pipeline tools let you switch between the visual graph and the underlying code.
- Where should I store the output of a pipeline?
- Anywhere your downstream consumers expect to find it: a CSV in a shared folder, a Parquet file, an Excel report emailed weekly, a database table, or a managed format like Delta Lake if you want versioning and time travel built in.