Stop Copy-Pasting Between Spreadsheets
If your weekly routine involves downloading three exports and stitching them into one master sheet, you're doing a robot's job. Here's the non-technical way to hand it off.
TL;DR. If every week you download three or four spreadsheets from different tools and spend an hour stitching them into a single master sheet — VLOOKUPs, manual copy-paste, renaming columns, fixing duplicates — you are doing the job of a small program by hand. A visual pipeline tool replaces that hour with 10 seconds. You build it once, click Run every week after that, and never manually merge again. No code, no server, no IT ticket.
The hour you don’t have
It’s early in the week and it hasn’t really started, because your recurring report comes first. You open four browser tabs, download four CSVs, open the master Excel file from last week, and begin:
- Copy rows from
sales-export-mar-13.csvinto the sales tab. - Copy rows from
returns-export-mar-13.csvinto the returns tab. - Run a VLOOKUP against the customer list, which lives in a different workbook.
- Rename three columns that the new export changed for no reason.
- Drop the refund rows that are duplicates from last week.
- Refresh the pivot table. Fix the one
#N/Athat breaks the total. - Paste the summary numbers into the Slack channel.
Every step is mechanical. None of it requires your judgment. The problem is that the moment you stop paying attention, a column shifts, a date parses wrong, and the Slack number is off by 4%.
This is the task small business software is quietly worst at: combining a batch of data from several places, on a schedule, into one shape.
Why the usual fixes don’t work
“Just use a bigger Excel workbook.” Excel is an exploration tool. The moment you try to use it as a recurring pipeline, you run into the two killers: column order changes, and formulas that silently break when a row count shifts. One surprise column and a VLOOKUP now references the wrong field, and you don’t know until someone notices the wrong total.
“Hire a developer.” Real option, but overkill for a one-hour-a-week task. A developer will build it, then you’ll need them again next time a source adds a column. The ongoing dependency becomes its own cost.
“Use a BI dashboard tool.” Looker Studio or Metabase are great for viewing data. They’re not designed for the step before the dashboard — the combining, cleaning, and reshaping that gets you to a clean table in the first place.
What you need is a tool designed exactly for the middle step: take several spreadsheets in, produce one spreadsheet out, remember how to do it forever.
What a visual pipeline looks like
Imagine a canvas where every input file is a box on the left, every transformation is a box in the middle, and the output file is a box on the right. Lines connect them. You edit each box by clicking on it and choosing from a menu — there is nothing to type, and nothing to remember.
Here’s a typical weekly-merge pipeline:
[Sales CSV]  --↘
[Returns CSV] --→ [Join on order_id] --→ [Group by region] --→ [Weekly Report.xlsx]
[Customers CSV] ↗
Four boxes. One report. You built the whole thing by dragging boxes and drawing lines between them.
Building the weekly report in Flowfile
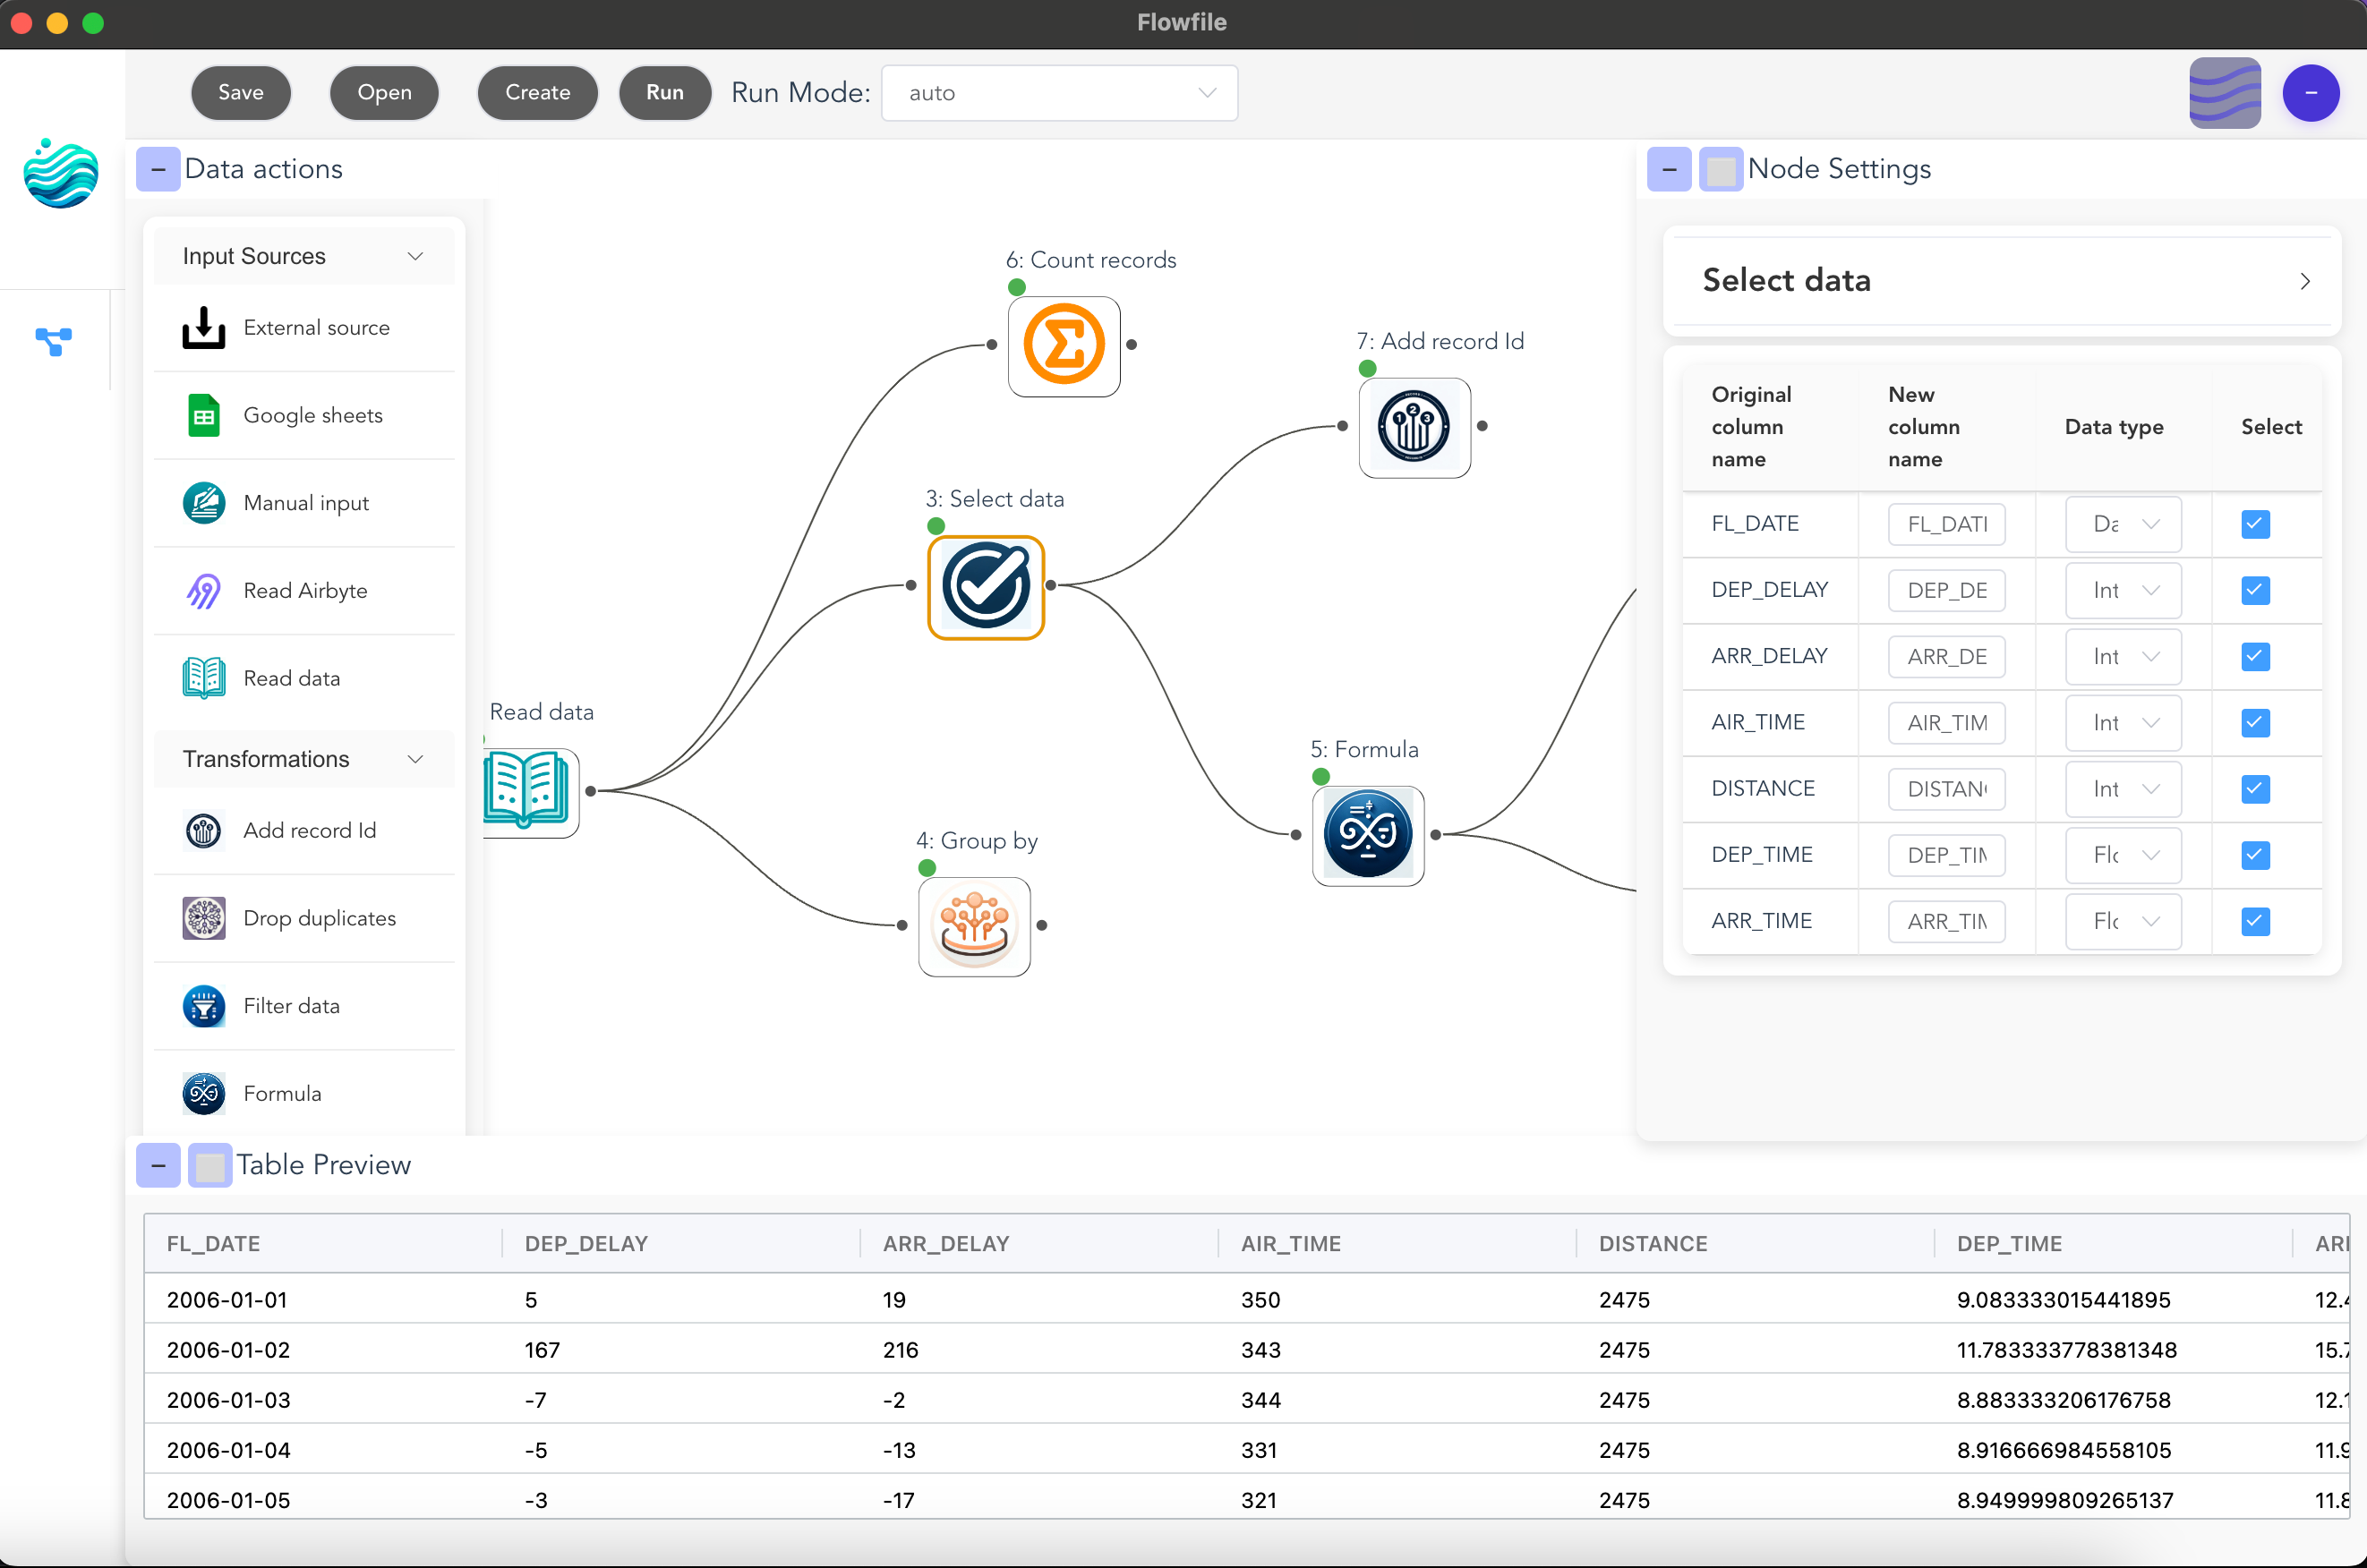
Flowfile is a free, open-source pipeline tool you install on your laptop. Here’s how the weekly merge looks in practice.
Step 1: Read the inputs
Drag each of your CSVs or Excel files onto the canvas. Each one becomes a Read node. Click on it, point it at the file, done. The rows appear in a preview pane below the canvas so you can see what you have.
If the files sit in the same folder every week — Downloads/weekly-reports/ for example — you point the node at the folder once and it picks up whatever is currently there. Future runs: drop the new files in, the node finds them automatically.
Step 2: Normalize columns
Add a Select node after each input. Untick columns you don’t need. Rename the ones that disagree — Cust_ID on one export and customer_id on another become the same field. The rename is saved in the pipeline; you do it once and never again.
Step 3: Join the files
Add a Join node. Left input: sales. Right input: returns. Key: order_id. Type: left join — you want to keep every sale even if it has no return. Add another Join for the customer list, keyed on customer_id.
Unlike VLOOKUP, this works the same way whether you have 80 rows or 8 million. The node doesn’t get slower, formulas don’t break when columns move, and the join type is explicit (you chose left, so you know what the output contains).
Step 4: Clean up
Most weekly reports need a few small cleanups:
- Drop duplicates. A Unique node on
order_idremoves duplicate rows in one click. - Fill missing values. A Formula node can say “if
regionis empty, useUnknown” without writing IF statements across 80,000 cells. - Filter to the current week. A Filter node on
order_date >= last Mondaykeeps only what you care about this week.
Step 5: Group and summarize
A Group By node replaces your pivot table. Pick the grouping field (region), pick the aggregations (sum of revenue, count of orders, average order value). The result is a small summary table ready for the report.
Step 6: Write the output
A Write Data node saves the result as Weekly Report.xlsx. Point it at the folder where the report lives. The next run overwrites it.
Total build time
For a typical weekly merge — three inputs, two joins, a filter, a group-by — budget an hour the first time. After that, re-running is: drop the new files into the folder, open the pipeline, click Run. Ten seconds.
What you keep from your current workflow
Almost everything:
- Your spreadsheets stay spreadsheets. Inputs are .csv or .xlsx, output is .xlsx. The rest of your team sees the same files they’ve always seen.
- Your formulas stay where they make sense. If the output sheet has a pivot and a chart you built in Excel, keep them. The pipeline just refreshes the underlying data.
- Nothing moves to the cloud. The tool runs locally, your files stay on your laptop, and the pipeline file itself is just another file you can back up or email.
What changes is the making part. You stop being the tool that merges spreadsheets. The pipeline becomes the tool. You go back to being a person.
Where to start
Flowfile is free and open-source — install it on your laptop, point it at your existing files, and start automating one report at a time. If you want to see the canvas before installing, the browser demo runs entirely in your browser with no signup.
A good first project: pick the single report you dread most each week. Build it once. Run it again the next week. After two runs, you’ll understand the pattern and you’ll want to build the second report. After a month, you won’t remember how you did this by hand.
Related reading. What Is a Data Pipeline? A Small Business Owner’s Guide explains the concept behind all of this in plain English, How to Automate Your Excel Workflows Without Writing Code focuses on the Excel-only version of this pattern, and The 10 Numbers Every Small Business Should Track Each Week shows a specific weekly scorecard you can build on top.
Frequently asked questions
- What if my spreadsheets never have exactly the same columns?
- This is the most common reason people give up. A pipeline tool handles it cleanly: you add a Select node to each input that renames columns into a consistent shape, and from then on the rest of the pipeline doesn't care where each row came from. You do the renaming once, not every week.
- Do I need to ask my IT person?
- No. Flowfile runs on your laptop like any other desktop app — installer, double-click, open it. Your data never leaves your machine unless you explicitly send it somewhere, which means you don't need anyone's approval to try it.
- What's the difference between this and a Zapier or Make automation?
- Zapier and Make are excellent at moving one record at a time between apps as it happens. This post is about the opposite job: combining a batch of rows from several places into one report on a schedule. Different tool for a different problem. Many small businesses use both.
- Will this replace my spreadsheets?
- Usually not — and you don't want it to. The pipeline reads your spreadsheets as inputs and writes a spreadsheet as output. You keep working in Excel or Google Sheets for exploration; the pipeline just removes the boring merging step in between.
- How long does it take to build the first one?
- For someone who's comfortable with Excel and has never touched a pipeline tool, budget 60–90 minutes for the first report. The second one takes 20 minutes because you're reusing the same patterns. After a month you can build one during a coffee break.