Your Lineage Graph Should Run Your Pipelines
In most stacks, lineage and orchestration are two products. Flowfile collapses them: the same graph that records what flows read what also fires the schedules that run them.
TL;DR. In most data stacks, lineage and orchestration are two separate products: one graphs what depends on what, the other decides when things run. They drift because the graph is a report and the scheduler is the runtime. Flowfile collapses the two — the same read-and-write edges that populate the lineage graph also fire the schedules. Table updates, not cron, drive downstream flows.
The two-tool split
The modern data stack, simplified:
- An orchestrator (Airflow, Prefect, cron) triggers pipelines. Usually on a schedule. Sometimes via sensor checks.
- A lineage catalog (DataHub, OpenLineage, Marquez, Collibra) records which tables depend on which. Usually populated by instrumentation the pipelines emit as they run.
Both tools know a great deal about the same DAG. But they’re separate products, in separate processes, often owned by separate teams. The orchestrator knows the edges as code — a DAG file says run_b depends on run_a. The lineage tool knows the edges as events — a JSON message arrives saying flow B read table X, wrote table Y.
Dagster is the partial exception. Its software-defined assets make the table, not the job, the first-class unit, and auto-materialization policies can fire downstream assets when upstream ones change — which is exactly the idea this post is about. The remaining difference is where the asset graph lives: in Dagster it’s declared alongside the orchestrator and points at external storage; in Flowfile it is the catalog, written by the same reader and writer nodes that actually touch the data. Same direction of travel — Flowfile gets there by not separating the layers in the first place.
For the two-tool world, the split has a cost.
Cost one: lineage goes stale. Someone adds a new source to a flow and forgets to update the emitter. The graph in the catalog is now wrong. You find out when a consumer complains about missing data — or when you try to trace an incident and the lineage points at the wrong upstream.
Cost two: scheduling uses cron instead of data events. Flow A runs at 02:00. Flow B reads flow A’s output and runs at 02:30. Why 30 minutes? Someone eyeballed flow A’s runtime, added a margin, wrote the cron entry. One morning flow A takes longer because the source file is bigger. Flow B reads stale data. The Tuesday report looks off and nobody notices until Friday.
Cost three: double bookkeeping. The same dependency is described twice — once in the DAG file the orchestrator reads, once in the metadata the lineage tool consumes. When the pipeline changes, both have to change. In practice, one lags the other, and the stale one is always the one you’re looking at when you need it.
Each cost is a symptom of the same structural problem: the same graph lives in two places, and the two places don’t agree.
What the catalog already knows
Flowfile’s catalog runs in the same process as the nodes that read and write tables. When a flow runs, two things happen automatically.
If the flow writes to a catalog table through a Catalog Writer node, the resulting row in catalog_tables carries source_registration_id and source_run_id — pointers to the flow and the specific run that produced the current version.
If the flow reads from a catalog table through a Catalog Reader node, a row is upserted into catalog_table_read_links:
class CatalogTableReadLink(Base):
    __tablename__ = "catalog_table_read_links"
    table_id        = Column(Integer, ForeignKey("catalog_tables.id"))
    registration_id = Column(Integer, ForeignKey("flow_registrations.id"))
    created_at      = Column(DateTime, default=func.now())

    __table_args__ = (
        UniqueConstraint("table_id", "registration_id", name="uq_table_read_link"),
    )
The unique constraint makes the write idempotent — running the same flow twice doesn’t create duplicate edges. A single upsert_read_link(table_id, registration_id) call keeps the graph current.
There is no separate instrumentation. No OpenLineage event to emit, no DAG file that has to mirror the catalog. The edges exist because the flow ran. The graph reflects what the pipelines actually do, not what someone declared they’d do.
That gives the catalog two queries with one-line implementations:
list_readers_for_table(table_id)— who consumes this table?list_read_tables_for_flow(registration_id)— what does this flow depend on?
Same data, both directions. Now the interesting part.
The same graph, but executable
Flowfile has three flow-schedule types:
| Type | Fires when |
|---|---|
interval | Every N seconds (wall-clock) |
table_trigger | A specific catalog table is updated |
table_set_trigger | Any of a set of catalog tables is updated |
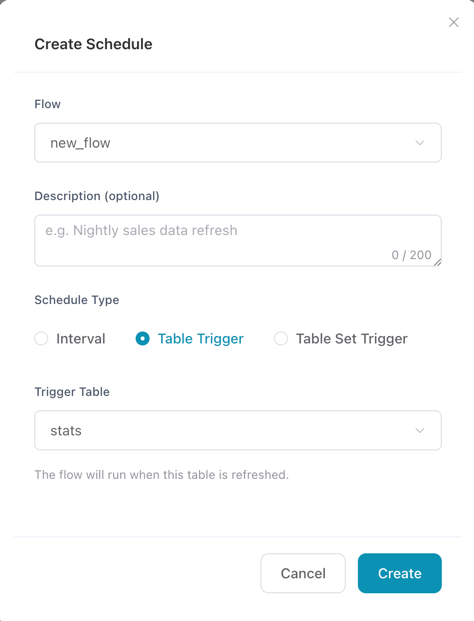
A table_trigger schedule says: run this flow when this table changes. The “this table” it points at is the same entity the lineage graph describes — the catalog_tables row, with the same id. There is no parallel definition.
In practice:
- Flow A has a Catalog Writer node that produces
analytics.sales.orders_daily. - Flow B has a Catalog Reader node that reads the same table, and a
table_triggerschedule watching it. - Flow A runs — manually, on an interval schedule, or as the downstream of its own table trigger. It writes the table; Delta records the new version; the catalog row’s
updated_atadvances. - The scheduler notices the change, fires flow B, and flow B reads the fresh data.
No 30-minute margin. No “hope flow A finished.” The schedule references the same table the consumer reads. When the table updates, the consumer runs.
The lineage graph and the scheduling graph are the same graph. That congruence keeps both honest: if you delete the reader node from flow B, the read link stops being refreshed and eventually ages out; if you add a reader node to flow C, the edge appears automatically and the scheduler can use it without anyone writing a new DAG file. The graph adapts to the code, not the other way around.
Real-time tables, by pulling
This is not a push system. Nothing streams. But between two mechanisms — table_trigger schedules that poll, and virtual flow tables that resolve on read — you get most of what “real-time” usually means in practice.
Pull on poll. The scheduler walks the catalog every cycle, comparing each table_trigger schedule’s last_trigger_table_updated_at against the watched table’s current updated_at. When a table has moved ahead, the schedule fires its flow and advances its last-seen timestamp. Latency is bounded by the poll interval — typically seconds. A downstream flow catches an upstream write without anyone subscribing to an event bus.
Pull on read. A virtual flow table doesn’t have a stored copy. Every time someone queries it, Flowfile recomputes it — replaying a captured Polars LazyFrame when possible, or re-running the producer flow when not. The data is never stale because the data is never pre-computed. The “update” is just what the upstream looks like at read time.
Neither is real-time in the strict sense of pushed-at-write. But for what analytics workloads actually need — a dashboard that catches yesterday’s write within seconds, a derived table that’s always live when you query it — a tight pull is operationally indistinguishable from a push, at a fraction of the infrastructure cost. No Kafka topic, no CDC feed, no webhook plumbing.
What you give up
This only works because the catalog, the reader and writer nodes, and the scheduler are in the same process. Flowfile is not a generic orchestrator — it orchestrates flows, not arbitrary jobs. If half your transformations are dbt models, half are Spark notebooks, and the rest are ad-hoc bash, reactive table scheduling over a shared catalog isn’t a drop-in; it’s a rearrangement.
What you gain is that the failure modes listed at the start stop existing. Lineage can’t drift from the pipelines because there’s nothing to drift — the graph and the runtime share rows in the same database. The scheduler can’t fire flow B too early because it fires on the write, not on the clock. There’s no second product to buy, instrument, or correlate; and the thing you look at when an incident happens is the thing that actually controlled the run, not a snapshot produced by a different tool three minutes ago.
The underlying idea
Lineage is usually a report. These tables depend on those tables — here’s a graph of it. Reports are downstream of the data; they describe, after the fact, what happened.
When the same graph becomes a runtime — when the edges in the catalog fire the next run — lineage stops being retrospective. You stop asking what changed and when did it propagate? because the answer is the table changed, and the propagation is a schedule that already ran.
A catalog that only documents is useful. A catalog that also executes is a different product.
Related reads: Virtual Flow Tables for how a catalog entry can be a pipeline, Why Your Data Should Stay on Your Laptop for the local-first case for the catalog itself, and Demystifying Delta Lake for the transaction log that makes “the table updated” a well-defined event.
Frequently asked questions
- Doesn't every data tool claim to track lineage?
- Most tools *report* lineage — they emit events to a separate catalog (OpenLineage, DataHub, Marquez) that reconstructs a graph after the fact. Flowfile is different because the lineage rows are written by the same Catalog Reader and Catalog Writer nodes that actually do the reads and writes. There's no separate emitter, no JSON event stream, no second database that can drift out of sync.
- How is this different from Dagster's software-defined assets?
- Dagster shares the same core insight — the table (asset) is the first-class unit, and dependencies between assets should drive execution. The practical difference is where the asset graph lives. In Dagster, you declare assets alongside the orchestrator and point them at external storage. In Flowfile, the asset graph *is* the catalog: the same rows the Catalog Reader and Writer nodes touch as they run, with the scheduler and the storage in the same process. Same idea, fewer layers.
- What if a flow reads from a source that isn't in the catalog?
- Then there's nothing to track — the lineage graph only covers tables registered in the catalog. Reads from raw files, databases, APIs, or cloud storage are visible in the flow definition itself but don't produce read-link rows. The practical pattern is: register anything you want downstream flows to react to as a catalog table, and let everything else stay a plain input node.
- Does this replace Airflow or Dagster?
- Only for flows built in Flowfile. It's not a generic orchestrator — it doesn't run arbitrary containers, bash scripts, or dbt models from a DAG file. If your transformations are already Flowfile flows, the reactive scheduling replaces the cron side of your orchestrator. If your stack is mixed (dbt + Spark + bash), you'd keep a top-level orchestrator and use Flowfile's scheduling for the internal dependencies.
- Can two flows both be triggered by the same table update?
- Yes. The scheduler looks up every enabled `table_trigger` schedule pointing at the updated table and fires each one. If flow B and flow C both read `analytics.sales.orders_daily` and both have table triggers on it, both run on the next update. There's also a `table_set_trigger` variant for watching any of several tables and firing on the first update that arrives.
- What happens if the upstream flow fails?
- The upstream never writes the table, so the table's `updated_at` doesn't change, so no trigger fires. Downstream flows don't run on stale data — they just don't run. The run record for the upstream failure is still in the catalog, visible in the flow's run history. You fix the upstream, it writes, and the downstream cascade resumes automatically.
- How is the table update detected?
- The scheduler polls the catalog and compares each `table_trigger` schedule's `last_trigger_table_updated_at` against the watched table's current `updated_at`. When they diverge, the flow fires and the schedule's last-seen timestamp is advanced. It's not push-based — it's a tight poll — so there's a small but bounded delay between write and trigger. For most analytics workloads, that's the right trade-off.