From Alteryx to Flowfile: A Practical Migration Walkthrough
How to rebuild a real Alteryx workflow in Flowfile — a weekly sales report with lookups, a pivot, and an Excel output — node by node, in under an hour.
TL;DR. Migrating from Alteryx to Flowfile looks intimidating and isn’t. The visual vocabulary translates almost one-to-one: Input Data becomes Read Data, Summarize becomes Group By, Cross Tab becomes Pivot, and so on. You rebuild rather than convert (no automated tool gets you there cleanly), which is faster than it sounds — usually under an hour per workflow — and doubles as a free audit of logic nobody has re-read in two years. This post walks through a realistic weekly sales report end-to-end, side-by-side.
The workflow we’re migrating
Here is an Alteryx workflow that half the business-intelligence teams on earth have a version of:
Input Data (orders.csv)
    → Select (drop internal_id, legacy_flag)
    → Join with Input Data (customers.xlsx) on customer_id
    → Filter to current quarter
    → Summarize by region & product: sum(spend), count(order_id)
    → Sort by spend descending
    → Cross Tab: rows = region, columns = product, values = spend
    → Output Data (weekly_report.xlsx)
A weekly report. Two file inputs. One join. One filter. One aggregation. One pivot. One export. This is the shape of most Alteryx workflows in the wild — and it rebuilds in Flowfile in about 20 minutes.
The node-to-node map
Before the walkthrough, here is the cheat sheet. Alteryx users can translate most workflows with this table alone:
| Alteryx node | Flowfile node | Notes |
|---|---|---|
| Input Data | Read Data | CSV, Excel, Parquet, JSON |
| Text Input | Manual Input | Type data directly |
| Output Data | Write Data | Same formats as input |
| Select | Select Data | Pick, rename, reorder columns |
| Formula | Formula | Create or modify columns |
| Filter | Filter Data | Row conditions |
| Sort | Sort Data | One or many columns |
| Unique | Drop Duplicates | On any subset of columns |
| Sample | Sample | First N, random N, etc. |
| Join | Join | Inner, left, right, outer |
| Append Fields | Cross Join | Cartesian product |
| Union | Union Data | Stack rows |
| Fuzzy Match | Fuzzy Match | Approximate-string joins |
| Summarize | Group By | All standard aggregations |
| Cross Tab | Pivot Data | Long → wide |
| Transpose | Unpivot Data | Wide → long |
| Text To Columns (split) | Text to Rows / Formula | Depending on the shape |
| Record ID | Add Record ID | Sequential row identifier |
| Run Command / Python | Python Script | Sandboxed Docker execution |
| Input Database | Read from Database | Postgres, MySQL, SQL Server, Oracle, DuckDB |
| Output Database | Write to Database | Same set |
| Amazon S3 Download / Azure | Read from Cloud Provider | S3, ADLS, GCS |
Nodes Alteryx users often ask about:
- Browse (Alteryx) — every Flowfile node has a built-in data preview; you don’t need a separate node.
- Comment / Container — Flowfile uses descriptions on each node plus the visual canvas organisation; there’s no dedicated container node (yet).
- Spatial / predictive — Flowfile doesn’t ship dedicated spatial or statistical nodes the way Alteryx does. For those, the Python Script or Polars Code node lets you drop in
shapely,geopandas,scikit-learn,statsmodels, etc.
Step-by-step rebuild
Assume you’ve already installed Flowfile (pip install flowfile, or the desktop app) and opened the visual canvas on a blank flow.
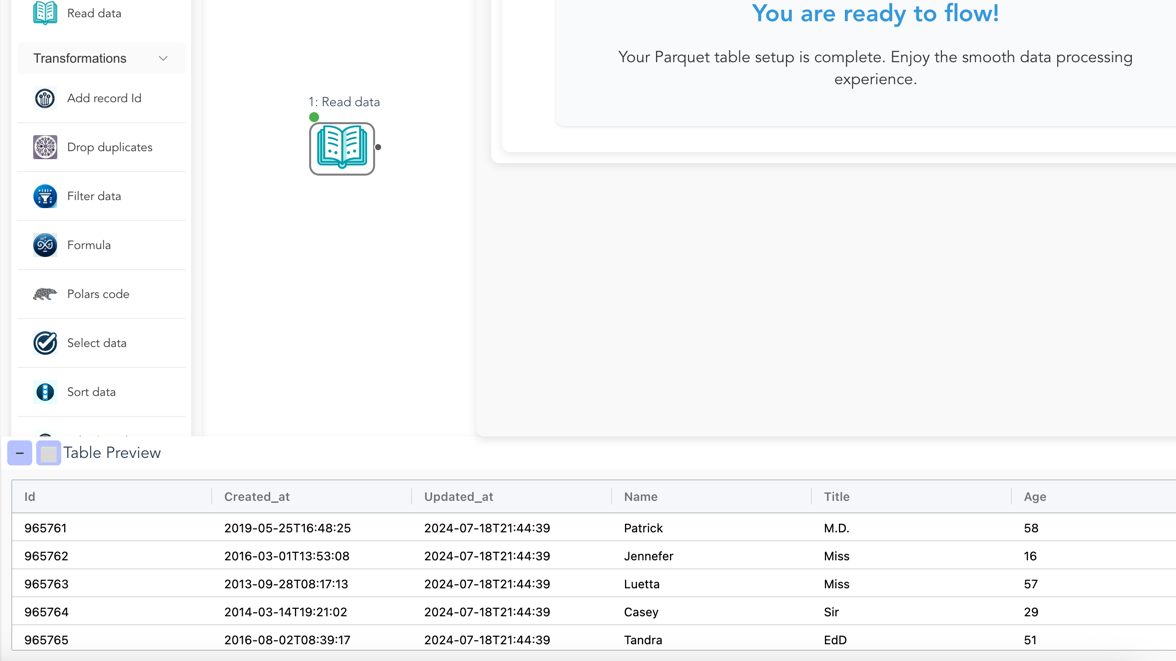
Step 1: The two inputs
Drag two Read Data nodes onto the canvas. Point the first at orders.csv, the second at customers.xlsx. Flowfile auto-detects column types and shows a preview of the first 100 rows in the right-hand panel.
Rename the nodes (every node has a description field). Call them “Load orders” and “Load customers”. Those descriptions will appear on the canvas and, later, in any code you generate.
Step 2: Trim the orders
Drop a Select Data node after “Load orders”. Uncheck internal_id and legacy_flag. Rename it “Drop internal columns”.
This is the direct equivalent of the Alteryx Select node. The uncheck-to-remove behaviour is identical.
Step 3: Join orders to customers
Add a Join node. Drag the output of “Drop internal columns” into its left input and the output of “Load customers” into its right. Configure:
- Left column:
customer_id - Right column:
customer_id - Join type:
left(keep all orders, attach customer where it matches)
Preview the output. You should see every order row now enriched with customer columns.
If your keys don’t quite match — you have Acme Corp in one file and ACME Corporation in the other — swap the Join for a Fuzzy Match node. We’ll cover that separately; for now assume the keys are clean.
Step 4: Filter to the current quarter
Add a Filter Data node. Condition: order_date >= '2026-01-01' AND order_date < '2026-04-01'. Flowfile’s filter syntax accepts Polars expressions, so pl.col("order_date").dt.quarter() == 1 also works.
Rename to “Current quarter only”.
Step 5: Aggregate
Add a Group By node. Group on region and product. Add two aggregations:
spend→sum→ aliastotal_spendorder_id→count→ aliasnum_orders
This is the Alteryx Summarize node with a different name.
Step 6: Sort
Add a Sort Data node. Sort on total_spend, descending.
Step 7: Pivot
Add a Pivot Data node (Alteryx’s Cross Tab). Configure:
- Rows:
region - Columns:
product - Values:
total_spend(sum)
Preview: a wide table with one row per region and one column per product.
Step 8: Write the Excel file
Add a Write Data node. Choose .xlsx, pick a path (weekly_report.xlsx), click save.
Hit Run on the canvas. The whole pipeline executes in seconds on anything up to a few million rows — Polars under the hood. The file lands where you pointed it.
That’s the full migration. Eight nodes. No code. Visually identical to the Alteryx equivalent in structure.
What you get that you didn’t have
You rebuilt the workflow. You got something for free in the process:
- It’s version-controllable. Flowfile flows save as a single file you can drop in Git.
.yxmdis technically XML-ish but nobody version-controls Alteryx in practice. - It can export as Python. Click Generate Code and your transform and file-I/O logic comes out as a standalone Polars script — one that runs anywhere Python runs, with no Flowfile dependency at execution time. (Database, REST, catalog, cloud, and ML steps export too, as FlowFrame code or with the
flowfilepackage still required.) The Alteryx equivalent is Alteryx Server plus a Designer licence. - It can schedule itself. Right-click the flow, set an interval, or trigger on an upstream catalog table update. No separate scheduler to provision.
- Your output can go into the catalog. Replace the
Write Data (.xlsx)with aWrite to Catalognode and the result becomes a Delta-backed, versioned, time-travellable table other flows can read — see Why Your Data Should Stay on Your Laptop. - It’s free and open-source. MIT-licensed; your flow isn’t hostage to a licence renewal.
The team that cares about open formats, laptop performance, and exporting to Python as a safety net picks this up fast. The team that cares about Alteryx’s statistical and spatial node libraries may want to keep some workflows on Alteryx and only migrate the ETL-shaped ones.
The rebuild playbook (at team scale)
If you are coordinating a team migration:
- Pick one workflow. Ideally a weekly batch job that is painful but not business-critical.
- Rebuild from scratch, not from conversion. Sit with the original author if possible. The conversation is useful; the rebuild is fast.
- Run both in parallel for one cycle. Compare outputs row-by-row.
duckdb EXCEPT SELECTacross the two files catches every difference in seconds. - Retire the Alteryx version. Disable the schedule, archive the
.yxmd, move on. - Repeat. Order workflows by pain-per-cycle, not by ease of migration. The ugliest Alteryx workflow is usually the fastest Flowfile win.
A team of three analysts typically retires a backlog of 20–30 workflows in a few weeks at this pace. Nobody ever reports missing the old tool — they report missing specific statistical nodes or a familiar keyboard shortcut, both of which are addressable.
When to stay on Alteryx
Be fair. There are reasons to stay:
- You rely heavily on Alteryx Spatial or the Predictive tools, and rebuilding them in Python isn’t worth the effort yet.
- You have Alteryx Server infrastructure and deeply-embedded scheduling/permissioning that would take longer to re-platform than it saves.
- Your team is non-technical enough that even Flowfile’s Python escape hatch feels scary, and you truly never need it.
Most teams don’t fall into these buckets. If you’re reading this, you probably don’t either.
Try the migration
The lowest-risk way to feel this is to pick your simplest real Alteryx workflow, install Flowfile on your laptop, and rebuild it from scratch while the Alteryx Designer is still open on your other monitor. You’ll know within 30 minutes whether the pattern fits.
- Install Flowfile — one command, runs locally.
- Browser demo — try the canvas without installing.
- GitHub — source, releases, issues.
Related reads: Alteryx alternatives in 2026: a field guide for the broader landscape comparison, Polars vs Pandas in 2026 for why Flowfile’s engine choice matters on real data volumes, and Connections, Secrets, and the Catalog in Flowfile’s Python API for when you want the Python API working alongside the canvas.
Frequently asked questions
- How long does a typical Alteryx-to-Flowfile migration take?
- One workflow of modest complexity (load, join, filter, group by, export) takes about 30–60 minutes to rebuild from scratch, including time to set up your database and file connections. Rebuilding is almost always faster than attempting to convert .yxmd files automatically, and the rebuild acts as a useful audit of the original logic.
- Can I open my .yxmd files directly in Flowfile?
- No — the formats are incompatible and no automated converter exists today. What does translate cleanly is the visual concept: every major Alteryx node has a direct Flowfile equivalent, and the canvas metaphor is identical. You drag, you connect, you preview.
- Which Alteryx nodes map to which Flowfile nodes?
- Input Data → Read Data; Select → Select Data; Filter → Filter; Formula → Formula; Join → Join; Fuzzy Match → Fuzzy Match; Summarize → Group By; Cross Tab → Pivot Data; Transpose → Unpivot Data; Sort → Sort Data; Unique → Drop Duplicates; Append Fields → Cross Join; Union → Union Data; Output Data → Write Data. The vocabulary is different; the concepts are the same.
- Do I need to abandon the visual workflow to get the Flowfile advantages?
- No. Flowfile is visual-first with a code escape hatch, not the other way around. You can rebuild your entire Alteryx workflow visually in Flowfile and never touch code. If you later want to schedule it, version it in Git, or export to production as a Python script, that option is there.
- What does Flowfile have that Alteryx doesn't?
- A built-in Delta Lake-backed catalog with time travel, native Polars performance, a Python API that works alongside the canvas, a code generator that exports a flow's transform and file-I/O core as standalone Polars scripts (no Flowfile dependency at runtime), a browser demo, and an open-source licence. What Alteryx still has: a larger node library for statistical and spatial analysis, and 15 years of Stack Overflow answers.
- Can I run old Alteryx workflows and new Flowfile pipelines side-by-side during migration?
- Yes — that's the recommended pattern. Rebuild one workflow in Flowfile, run both for a month, compare outputs row-by-row, then retire the Alteryx version. Migrating a team one workflow at a time avoids the all-or-nothing risk of a full cutover.